 david942j/heapinfo
An interactive memory info for pwning / exploiting








As pwn lovers, while playing CTF with heap exploitation, we always need a debugger (e.g. gdb) for tracking memory layout. But we don't really need gdb if we want to see whether the heap layout same as our imagination or not. Hope this small tool helps us exploit easier ;).
HeapInfo is very helpful when binary has somehow anti-debugger limitations, e.g. being ptraced. HeapInfo still works because it doesn't use ptrace.
Implements with Ruby because I love Ruby :P. But might implement with Python (if no others did) in the future.
If you prefer pwntools for exploiting, you can still use HeapInfo in irb/pry as a small debugger.
Any suggestion of features or bug issues is welcome.
HeapInfo is still under developing for more features, so the version might change frequently :p
$ gem install heapinfo
victim is being traced! i.e. you can use ltrace/strace/gdb and HeapInfo simultaneously!dump - Dump arbitrarily address memory.layouts - Show the current bin layouts, very useful for heap exploitation.offset - Show the offset between given address and segment. Very useful for calculating relative offset.canary - Fetch the value of stack guard!x - GDB-style commands.s - GDB-style commands.find - GDB-style commands.require 'heapinfo'
# ./victim is running
h = heapinfo('victim')
# or use h = heapinfo(20568) to specify a pid
# will present simple info when loading:
# Program: /home/heapinfo/victim PID: 20568
# victim base @ 0x400000
# [heap] base @ 0x11cc000
# [stack] base @ 0x7fff2b244000
# libc-2.19.so base @ 0x7f892a63a000
# ld-2.19.so base @ 0x7f892bee6000
# canary value: 0x84b742f03d94c100
# query segments' info
"%#x" % h.libc.base
#=> "0x7f892a63a000"
h.libc.name
#=> "/lib/x86_64-linux-gnu/libc-2.19.so"
"%#x" % h.elf.base
#=> "0x400000"
"%#x" % h.heap.base
#=> "0x11cc000"
NOTICE: When the process is not found, most methods will return nil. One way to prevent some error happend is to wrapper methods within debug, the block will be ignored while doing remote exploitation.
h = heapinfo('remote')
# Process not found
h.pid # nil

# wrapper with `debug` so that no error will be raised when pwning remote service
h.debug { fail unless leak_libc_base == h.libc.base }
Query content of specific address.
NOTICE: You MUST have permission of attaching a program, otherwise dump will fail.
i.e. /proc/sys/kernel/yama/ptrace_scope set to 0 or run as root.
h.debug do
  p h.dump(:libc, 8)
  #=> "\x7FELF\x02\x01\x01\x00"
  p h.dump(:heap, 16)
  #=> "\x00\x00\x00\x00\x00\x00\x00\x00\x31\x00\x00\x00\x00\x00\x00\x00"
  p h.dump('heap+0x30', 16) # support offset!
  #=> "\x00\x00\x00\x00\x00\x00\x00\x00\x81\x00\x00\x00\x00\x00\x00\x00"
  p h.dump('heap+0x30 * 3 + 0x8', 16) # and even complex formula!
  #=> "\x00\x00\x00\x00\x00\x00\x00\x00\x00\x00\x00\x00\x00\x00\x00\x00"
  p h.dump(:program, 8)
  #=> "\x7FELF\x02\x01\x01\x00"
  p h.dump(0x400000, 8) # or simply give address
  #=> "\x7FELF\x02\x01\x01\x00"
end

# invalid example:
# h.dump('meow') # no such segment
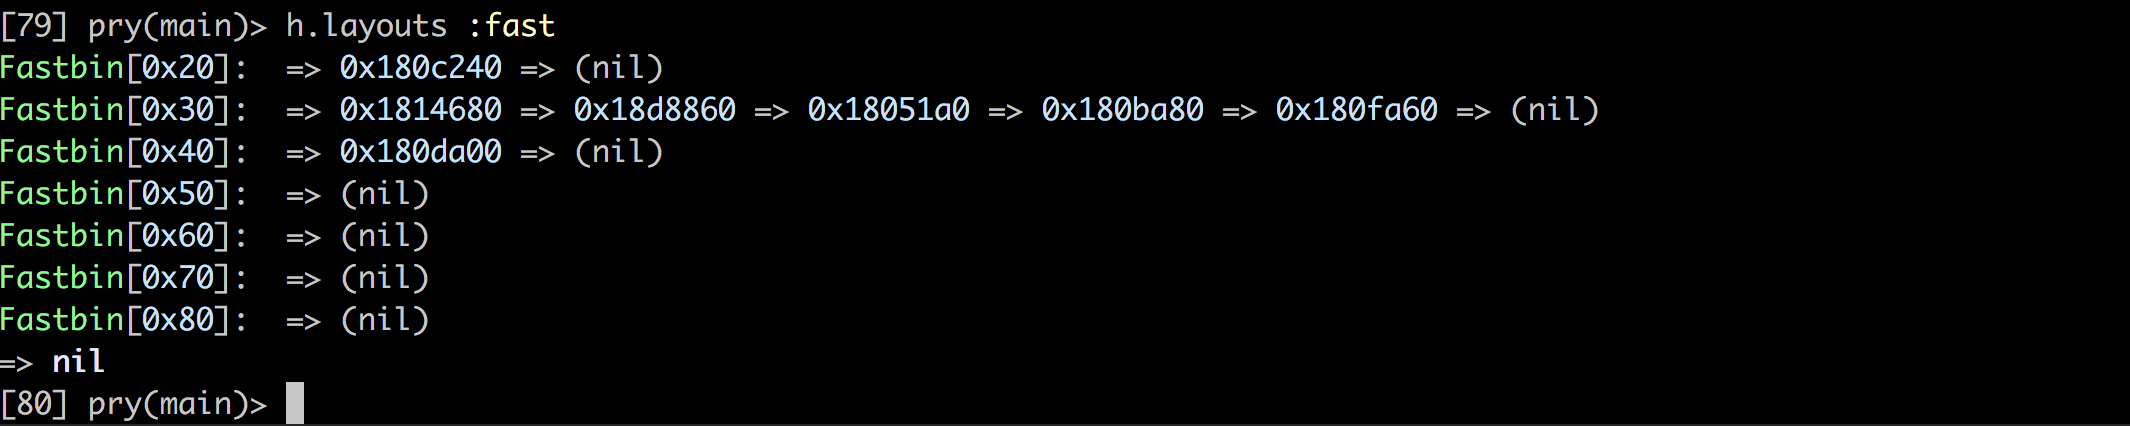
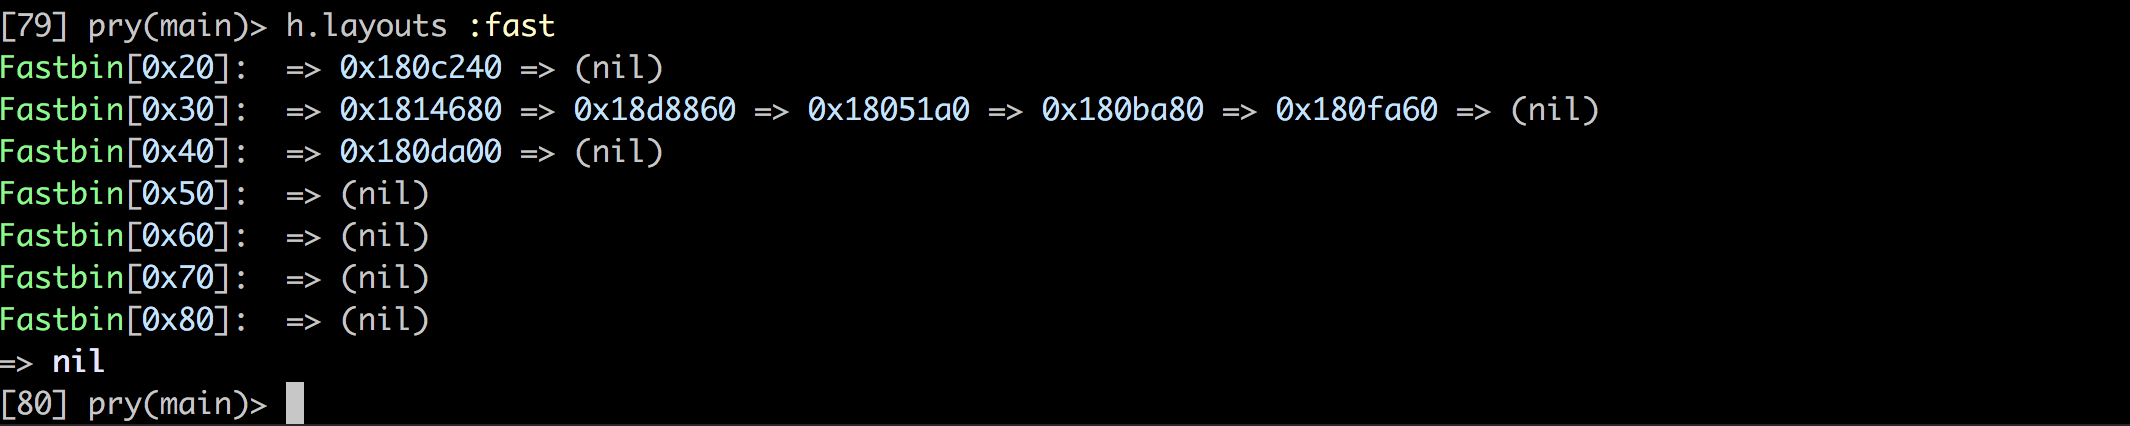
h.layouts :fast
h.layouts :unsorted, :small

h.layouts :tcache

h.offset(0x7fda86fe8670)
# 0xf6670 after libc
h.offset(0x1839cd0, :heap) # specific segment name
# 0x20cd0 after heap
h.offset(0x1839cd0)
# 0x20cd0 after heap

h.canary.to_s(16)
#=> '84b742f03d94c100'
h.x 8, :heap

Provide a searcher of memory, easier to use than in (naive) gdb.
Support search integer, string, and even regular expression.
h.find(0xdeadbeef, 'heap+0x10', 0x1000)
#=> 6299664 # 0x602010
h.find(/E.F/, 0x400000, 4)
#=> 4194305 # 0x400001
h.find(/E.F/, 0x400000, 3)
#=> nil

# Get relative offset of searching result
h.find('/bin/sh', :libc, rel: true)
#=> 1622391 # 0x18c177
h.offset(h.find('/bin/sh', :libc))
# 0x18c177 after libc
HeapInfo currently only run tests on Ubuntu, followings are tested glibc versions:
