 beelzebub-labs/azazel
eBPF-powered silent observer for containerized runtimes, built for malware analysis sandboxes and Agentic AI monitoring.





A lightweight eBPF-based runtime security tracer purpose-built for malware analysis sandboxes. Drop a sample into an isolated container, and Azazel captures every syscall, file touch, network connection, and suspicious behavior, then hands you a clean JSON stream of everything that happened.
Whether you are building an automated Malware Analysis Sandbox or need 24/7 Runtime Monitoring for autonomous AI Agents, Azazel provides surgical, invisible, and AI-ready JSON telemetry.
Usage:
  azazel [flags]
  azazel [command]

Commands:
  run-sandbox       Run a malware sample in an isolated Docker sandbox and trace it
  list-containers   List running containers
  version           Print version

Global Flags:
  -c, --container strings   Container ID(s) to filter (can specify multiple)
  -o, --output string       Output file path (default: stdout)
      --pretty              Pretty-print JSON output
      --stdout              Also print to stdout when --output is set
  -v, --verbose             Verbose logging
      --no-summary          Disable summary on exit
  -h, --help                Help
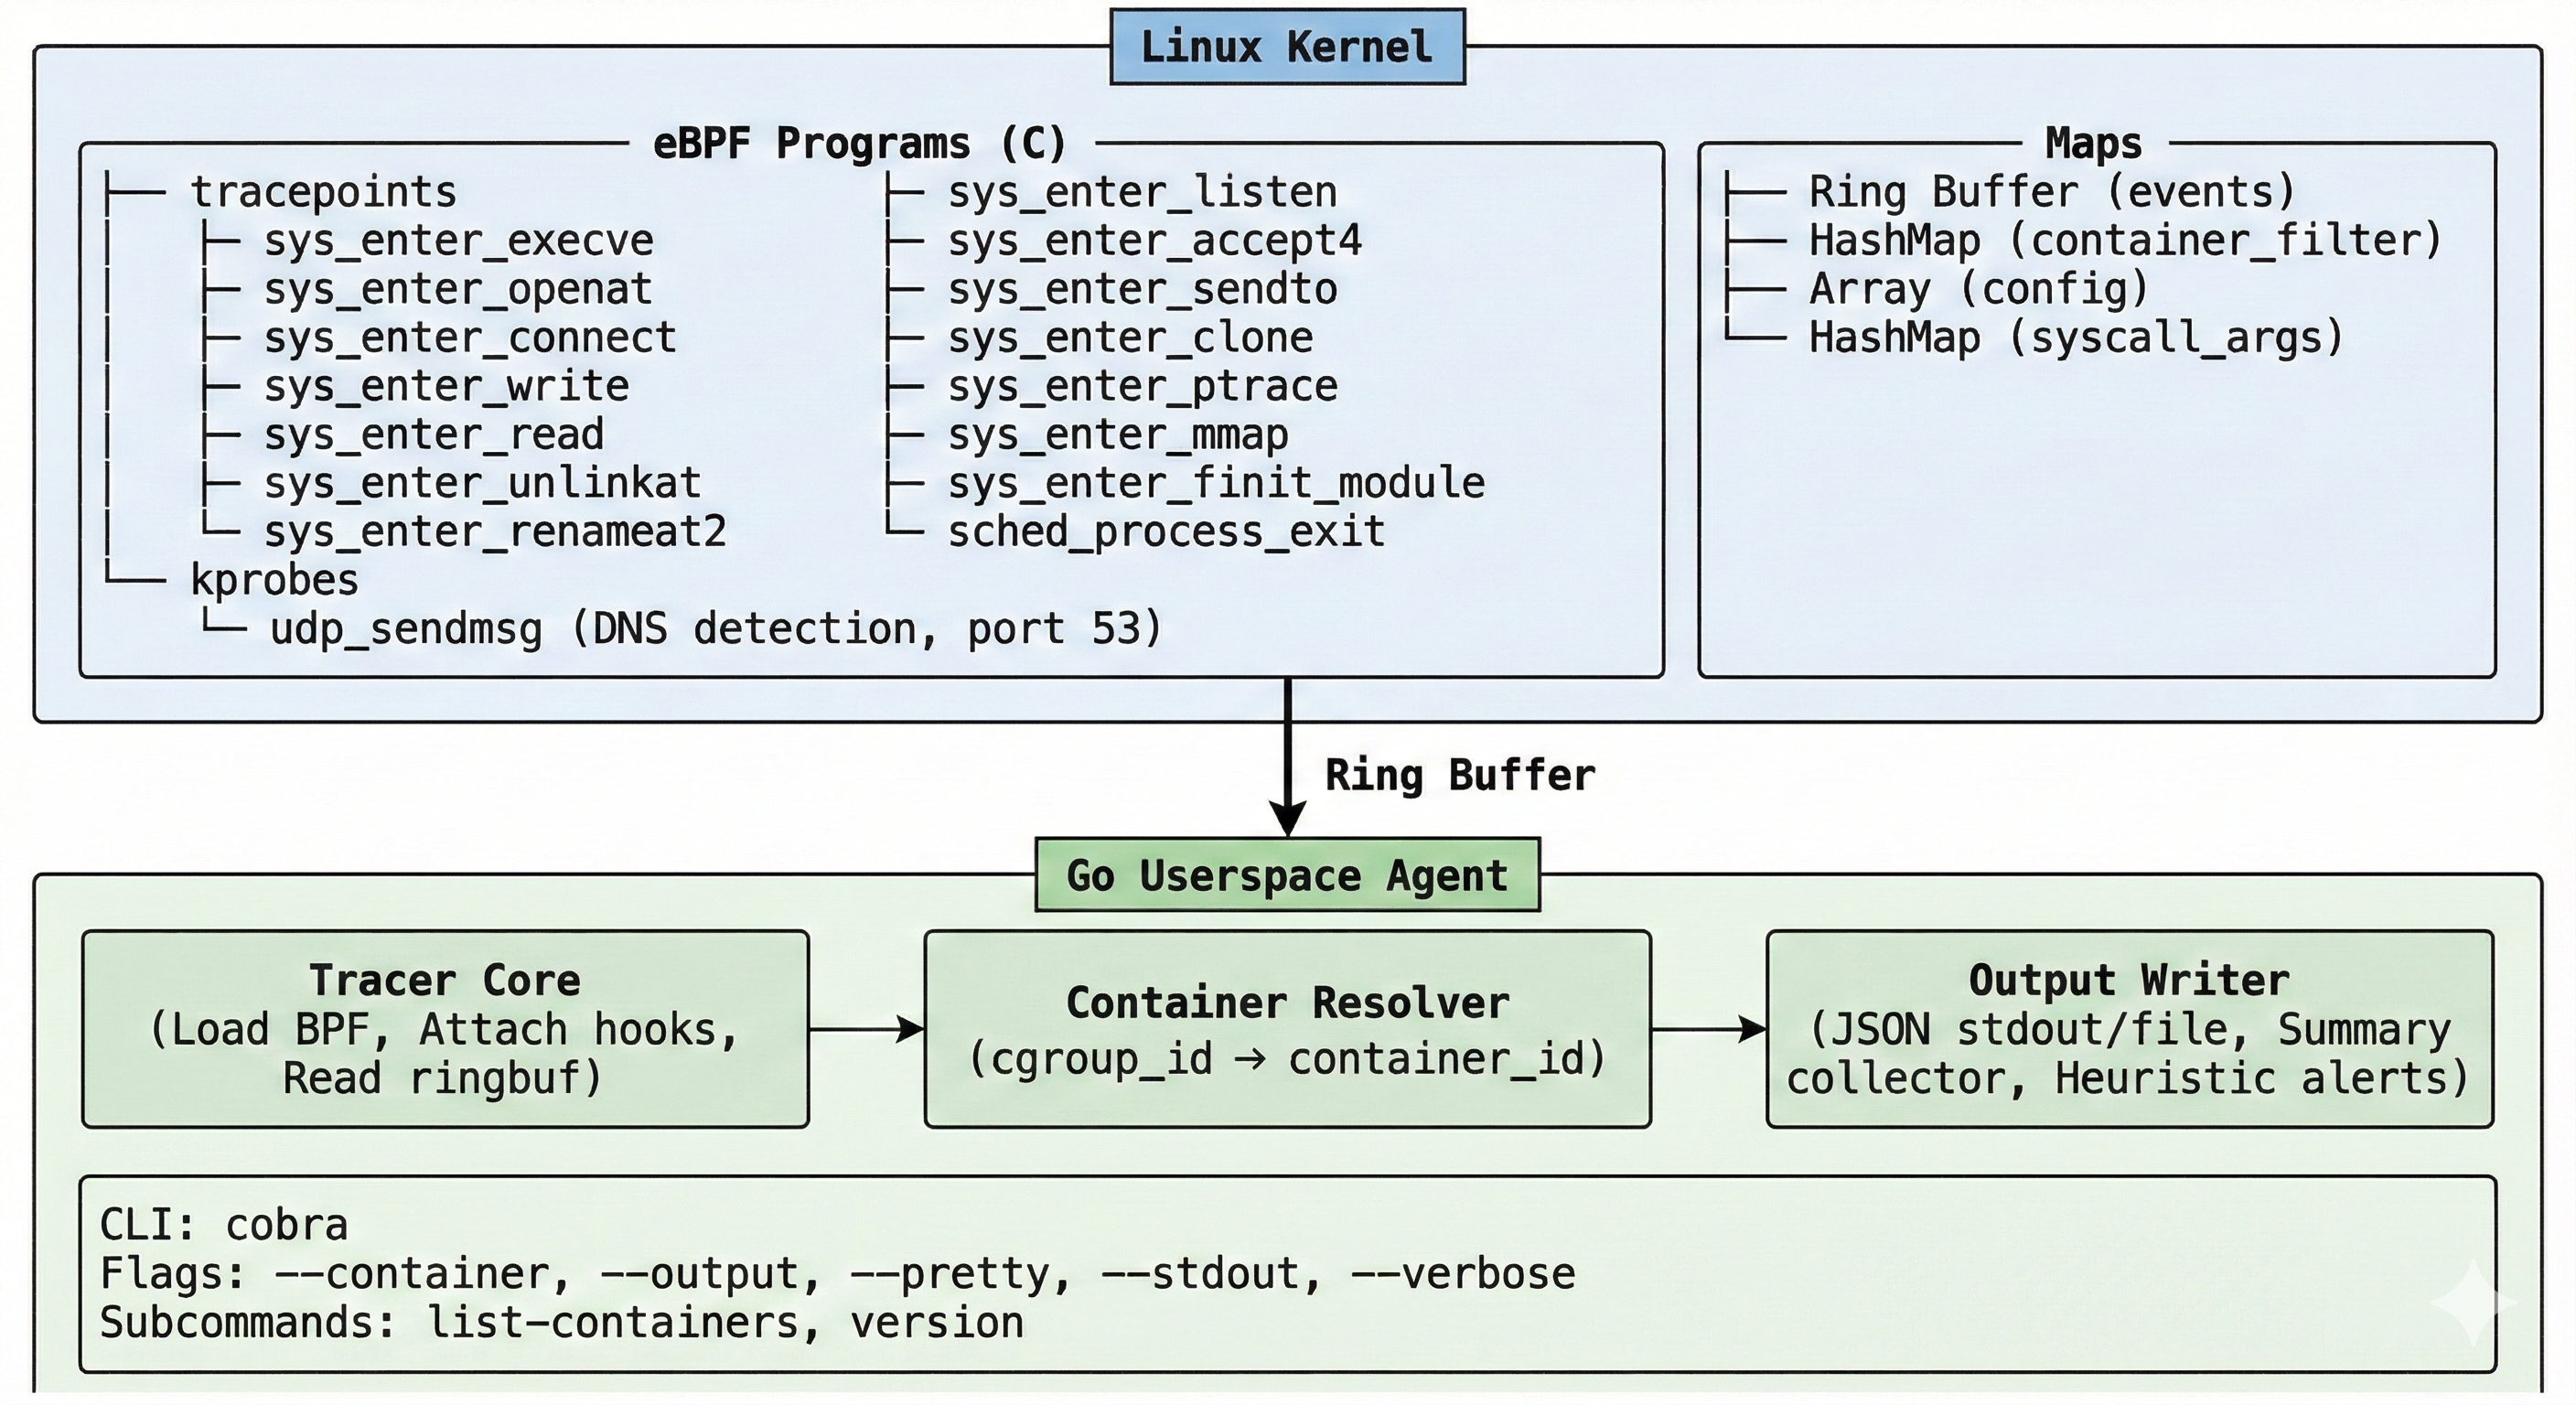
| Category | Events | Details |
|---|---|---|
| Process | process_exec, process_exit, process_clone | Full process tree: filename, argv, exit codes, clone flags, parent PID |
| File | file_open, file_write, file_read, file_unlink, file_rename | Pathnames, flags, byte counts |
| Network | net_connect, net_bind, net_listen, net_accept, net_sendto, net_dns | IPv4/IPv6 addresses, ports, DNS detection via kprobe on udp_sendmsg |
| Security | mmap_exec, ptrace, module_load | W+X memory mappings, process injection attempts, kernel module loading |
19 hook points total — tracepoints on syscall entry + a kprobe for DNS detection.
vmlinux.h, works across kernel versions without recompilationjq, Elasticsearch, Splunk, or your own pipeline/tmp, sensitive file access (/etc/shadow, /proc/self/mem), ptrace, W+X mmap, and kernel module loadingCONFIG_DEBUG_INFO_BTF=yVerify your kernel:
# BTF support (required)
ls /sys/kernel/btf/vmlinux

# Kernel version
uname -r
# Clone
git clone https://github.com/beelzebub-labs/azazel.git
cd azazel

# Build the dev container
make docker-dev

# Enter it (privileged, with host PID/cgroup namespace)
make docker-dev-run

# Inside the container:
make vmlinux    # Generate kernel type definitions
make generate   # Compile BPF C → Go bindings
make build      # Build the binary
# Trace everything, output to stdout
sudo ./bin/azazel

# Trace everything, save to file with pretty JSON
sudo ./bin/azazel --output events.json --pretty

# Trace only a specific container
sudo ./bin/azazel --container <container_id> --output events.json

# List running containers
sudo ./bin/azazel list-containers
# Inside the dev container
make test
This builds the binary, starts the tracer, runs a malware behavior simulator, then validates that all expected event types were captured.
Every event is a single JSON line (NDJSON):
{
  "timestamp": "2025-01-15T14:30:22.123456789Z",
  "event_type": "process_exec",
  "pid": 12345,
  "tgid": 12345,
  "ppid": 12300,
  "uid": 0,
  "gid": 0,
  "comm": "bash",
  "cgroup_id": 6789,
  "container_id": "a1b2c3d4e5f6",
  "filename": "/tmp/suspicious_binary",
  "args": "/tmp/suspicious_binary"
}
{
  "timestamp": "2025-01-15T14:30:22.234567890Z",
  "event_type": "net_connect",
  "pid": 12345,
  "tgid": 12345,
  "ppid": 12300,
  "uid": 0,
  "gid": 0,
  "comm": "curl",
  "cgroup_id": 6789,
  "container_id": "a1b2c3d4e5f6",
  "sa_family": "AF_INET",
  "dst_addr": "93.184.216.34",
  "dst_port": 443
}
When the tracer shuts down (Ctrl+C or SIGTERM), it prints a summary to stderr:
========================================
 Azazel Summary
========================================
 Total events: 1847

 Event counts:
   file_open             892
   file_write            312
   process_exec           47
   net_connect            23
   ...

 Security Alerts (3):
   [MEDIUM] execution from suspicious path: /tmp/suspicious_binary (pid=12345 comm=bash)
   [MEDIUM] sensitive file access: /etc/shadow (pid=12346 comm=cat)
   [CRITICAL] memory mapped as WRITE+EXEC (possible code injection/unpacking) (pid=12347 comm=malware)
========================================
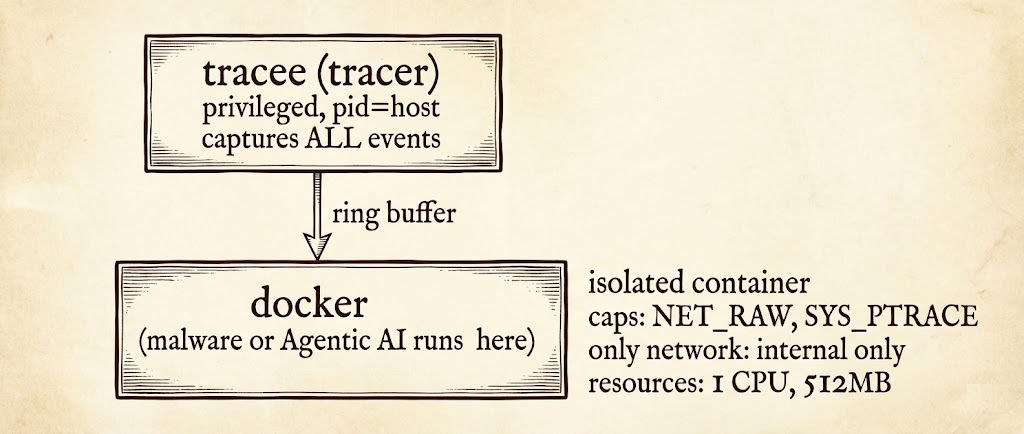
The included docker-compose.yml sets up a complete analysis environment:
# Start the sandbox
docker compose up -d

# Copy a sample into the sandbox
docker cp ./samples/malware.elf sandbox:/tmp/sample

# Execute it
docker exec sandbox /tmp/sample

# Events are written to ./output/events.json
cat output/events.json | jq .
# Analyze a sample end-to-end: hash → trace → report
sudo ./analyze.sh ./samples/malware.elf 30
This produces:
output/events_<timestamp>.json — raw event streamoutput/report_<timestamp>.md — Markdown report with hashes, event summary, network connections, and security alertsUsage:
azazel [flags]
azazel [command]
Commands:
list-containers List running containers
version Print version
Flags:
-c, --container strings Container ID(s) to filter (can specify multiple)
-o, --output string Output file path (default: stdout)
--pretty Pretty-print JSON output
--stdout Also print to stdout when --output is set
-v, --verbose Verbose logging
--no-summary Disable summary on exit
-h, --help Help
