

netwatch v0.32.3
Real-time network diagnostics in your terminal. One command, zero config, instant visibility.
NetWatch
Network diagnostics in your terminal.







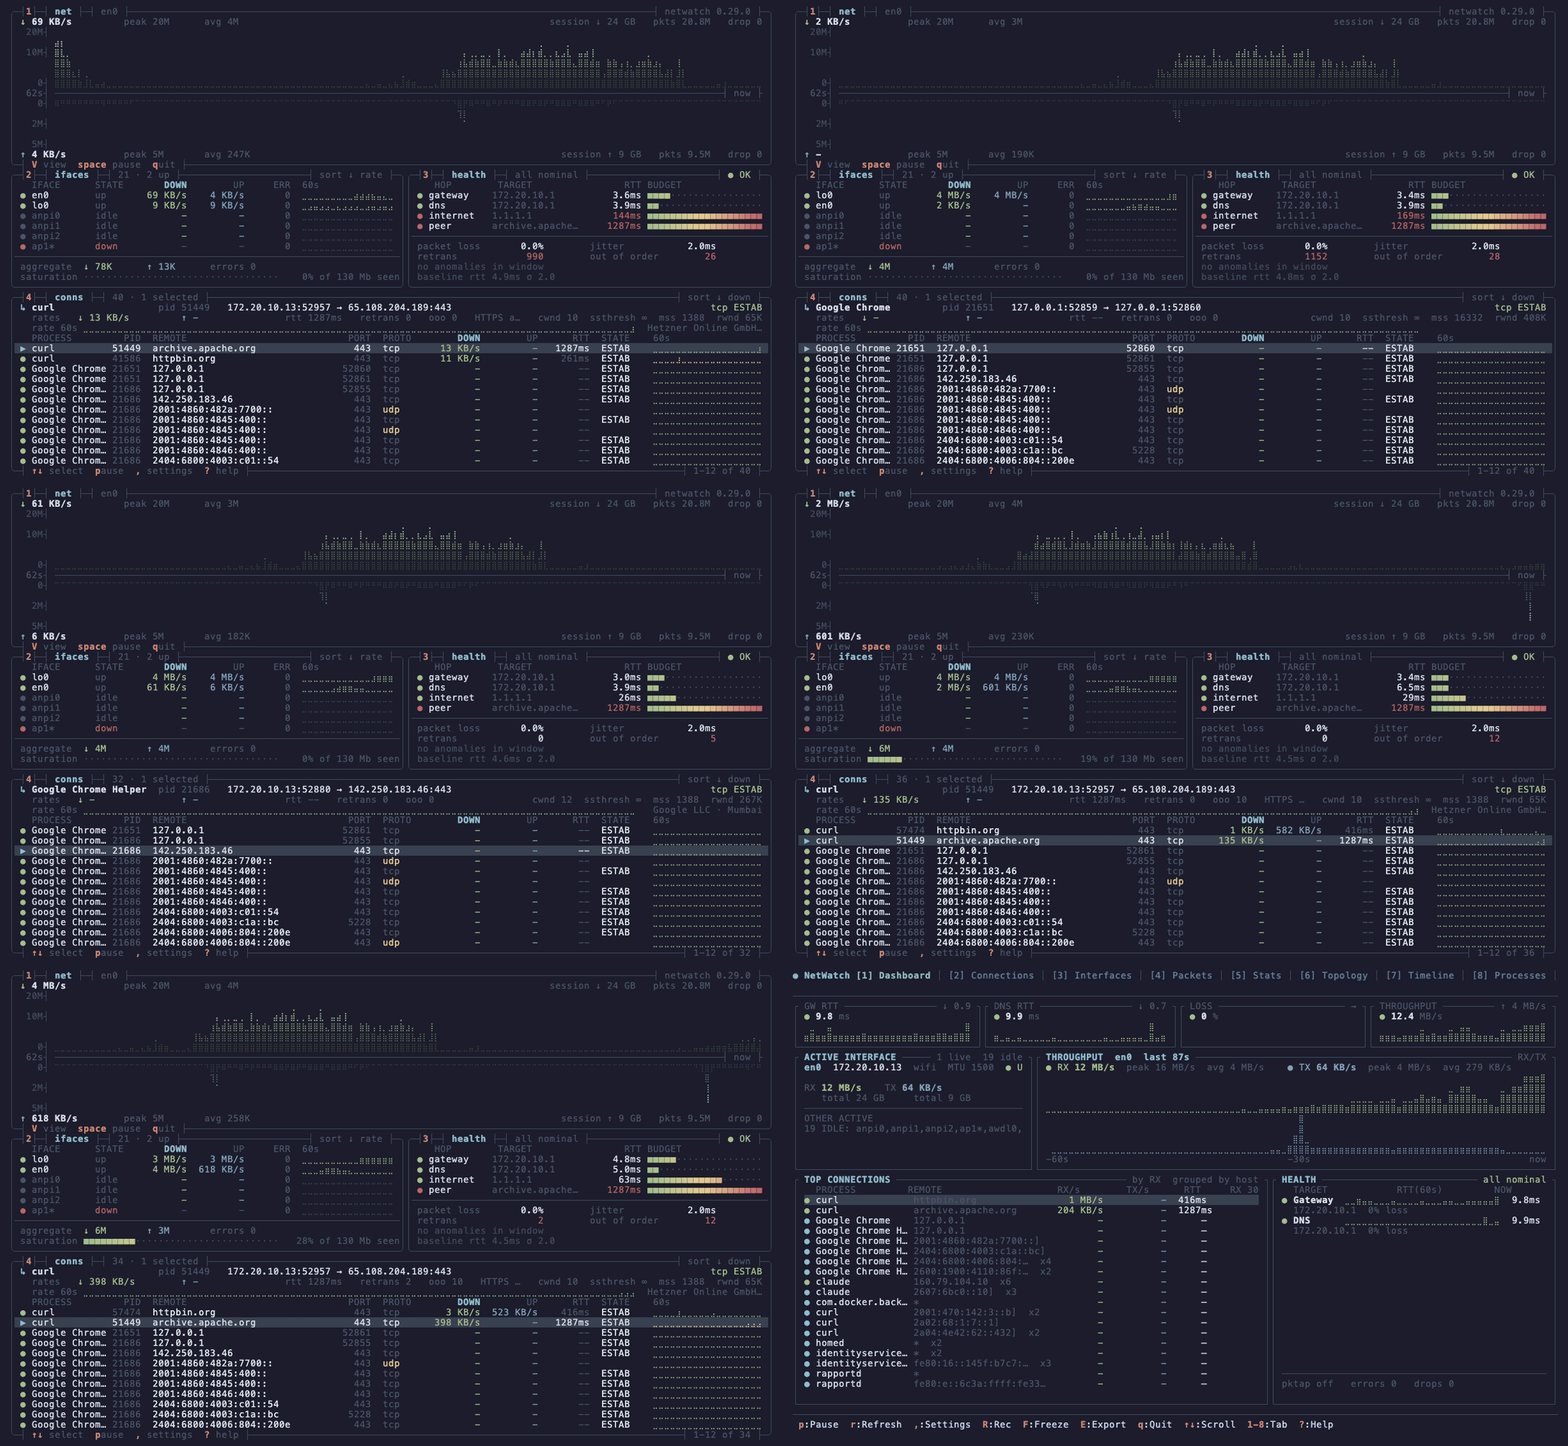
netwatch --view dense. Four boxes, no chrome, every keybind on a border. Download grows up from the axis, upload grows down.
One binary, no config. sudo netwatch and you have live capture with L7 decode, process attribution where available, and a diagnostic engine that opens an issue when a learned baseline breaks and closes it when the fix holds.
Install
brew install netwatch                 # macOS / Linux
scoop install netwatch                # Windows (needs Npcap)
cargo binstall netwatch-tui           # prebuilt binary, anywhere with Rust
paru -S netwatch-tui                  # Arch (AUR)
nix-shell -p netwatch                 # NixOS / Nix
conda install -c conda-forge netwatch # conda / mamba (Linux, macOS)
Debian / Ubuntu (apt repository):
curl -fsSL https://matthart1983.github.io/netwatch/apt/netwatch.gpg \
  | sudo tee /usr/share/keyrings/netwatch.gpg >/dev/null
echo "deb [signed-by=/usr/share/keyrings/netwatch.gpg] \
https://matthart1983.github.io/netwatch/apt stable main" \
  | sudo tee /etc/apt/sources.list.d/netwatch.list
sudo apt update && sudo apt install netwatch
Fedora: sudo dnf copr enable matthart1983/netwatch && sudo dnf install netwatch
Container: docker run --rm -it --net=host --pid=host --cap-add=NET_RAW ghcr.io/matthart1983/netwatch
Binaries for macOS, Linux (x86_64, aarch64, armv5te), FreeBSD (x86_64) and
Windows are on the
releases page, with
.deb, .rpm, checksums and signed provenance. The Linux builds are static and
need nothing installed; Windows needs Npcap.
FreeBSD is best-effort. netwatch-freebsd-x86_64 is built on FreeBSD 13.5 and
dynamically links the base system's libc and libpcap, so it needs FreeBSD 13 or
newer (it cannot be static). On anything older, build from source with
cargo install netwatch-tui.
Verifying a download ·
every channel.
Run
netwatch              # interfaces, connections, config. No privileges.
sudo netwatch         # enables capture where elevated access is required
netwatch --lite       # one 80x24 screen
netwatch --view dense # four boxes, 130x44 or larger
1 to 9 and 0 switch tabs, V cycles the three views, ? shows every key. To run without sudo on Linux, grant the capabilities once: sudo setcap 'cap_net_raw,cap_bpf,cap_perfmon+eip' "$(which netwatch)" (why and when to repeat it).
The tabs
| # | Tab | Shows |
|---|---|---|
| 1 | Dashboard | Latency tiles, mirrored throughput, the link carrying it, connections rolled up per process |
| 2 | Connections | Every socket with process, PID, state, GeoIP, RTT, retransmits |
| 3 | Interfaces | Addresses, MTU, rates, errors, drops |
| 4 | Packets | Live decode, TLS 1.3 decryption, JA4, stream tracking, display filters, PCAP export |
| 5 | Stats | Protocol breakdown and handshake-timing histogram |
| 6 | Topology | Machine, gateway, DNS, top hosts, traceroute |
| 7 | Timeline | Connections by TCP state, with alerts |
| 8 | Processes | Bandwidth per process |
| 9 | Diagnose | Issue, cause, fix, verified close. report.md from the same objects |
| 0 | Egress | Learned destinations, promoted policy, drift |
Every keybinding, display filters, decoders, themes, configuration.
Views
V cycles all three without a restart; the collectors keep running.
| View | Size | For |
|---|---|---|
| Full | any | The ten tabs above |
Lite (--lite) | 80x24 | An SSH session to a Pi, or a tmux split |
Dense (--view dense) | 130x44+ | The hero image: four boxes, braille throughput, kernel TCP detail |