Back to updates
New releaseAug 10, 2026

netwatch v0.28.2

Real-time network diagnostics in your terminal. One command, zero config, instant visibility.

Share

NetWatch

See what your network is actually doing — live, in your terminal.
A network monitor that reads encrypted traffic, names the process behind every connection, and catches malware calling home. One binary. Zero config.

crates.io downloads Release Packaging status Platform License

Terminal Trove Tool of The Week

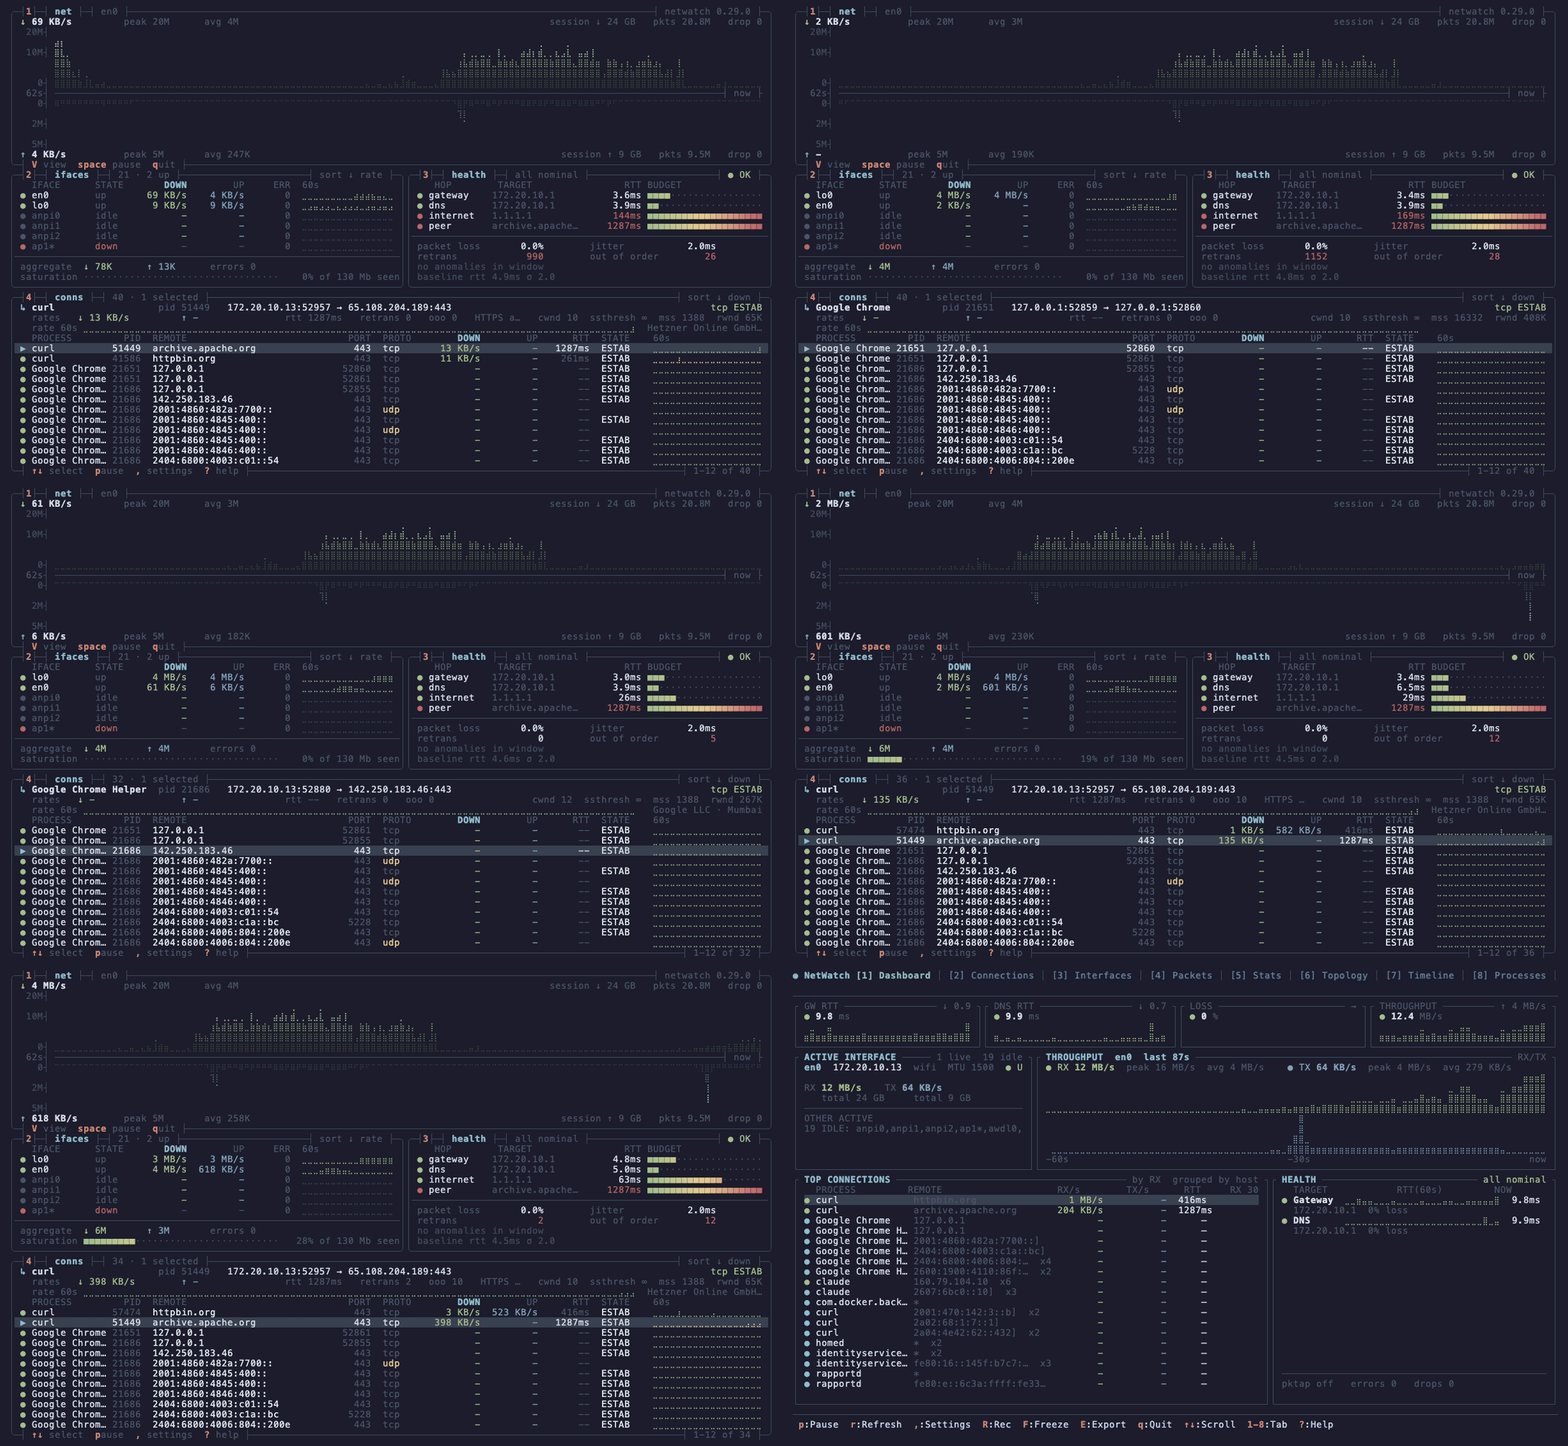
NetWatch Dense: four boxes filling the terminal — a mirrored braille throughput graph with download growing up from the time axis and upload growing down from it, per-interface rates with 60-second sparklines, four-hop latency budgets, and a connection table whose selected row's detail is hoisted into the top of the same box carrying kernel cwnd / ssthresh / mss / rwnd

Everything at once, with zero rows of chrome — no header bar, no menu bar, no status bar. Download grows up from the shared time axis, upload grows down from it, so traffic symmetry is a shape you recognise before you read a number. Colour encodes magnitude, not series.

A tour of the live NetWatch TUI: dashboard, connections with process attribution, live packet capture and decode, network topology, and the egress profile of each program

…and the default ten-tab instrument underneath it, one V away and sharing the same warm collectors — the dashboard, the program behind every socket, deep packet inspection, the network map, and what each program talks to.


Most network tools answer one question — "what's using my bandwidth?" — and stop. NetWatch keeps going. It decodes the protocols on the wire, tells you which program opened each connection, and watches for the patterns that mean trouble — a port scan, malware beaconing to a command server, data sneaking out over DNS. When something looks wrong, one keypress freezes a portable evidence bundle you can attach to a bug report.

Think of it as one zero-config binary that does the job of a bandwidth meter, the triage view of Wireshark, and a lightweight intrusion detector — without leaving the terminal.

It scales to the question you're asking — in both directions: --view dense fills a big terminal with four zero-chrome boxes, and netwatch --lite is one 80×24 screen for "what's using my network right now?"; the full ten-tab view is there when the answer is "something I need to investigate" — one keypress apart, sharing the same live capture.

Made for blue-teamers, incident responders, SREs, and homelabbers who need to see what's happening right now — not parse a capture file an hour later.

650+ tests · Landlock-sandboxed (Linux) · safely parses hostile traffic

And the part no other terminal tool does at all: NetWatch learns what each program on the machine talks to, turns that observed baseline into a policy with one keypress, and tells you the moment a program starts talking somewhere new.

NetWatch learning what curl talks to, promoting that baseline to an egress policy, and then flagging a new destination as drift

Observe → promote → warn. The baseline becomes a policy with one keypress; the next new destination arrives as drift.

Why NetWatch

  • 🔓 Read encrypted traffic you control — point a browser or app's SSLKEYLOGFILE at NetWatch and watch the plaintext of its TLS 1.3 sessions decode live, the same way Wireshark does it. No proxy, no certificates, nothing in the middle.
  • 🛰️ Learn what every program talks to, then get told when it changes — NetWatch watches which destinations each process reaches (hostname from the ClientHello, autonomous system, port), and one keypress promotes that observed baseline into an egress policy. From then on it warns when a program starts talking somewhere new. That is the sentence a firewall ruleset cannot express: curl used to reach only api.github.com, and today it reached something else. Observe-only — it never blocks.
  • 🧬 Fingerprint the software behind a connection — JA4 turns each TLS/QUIC handshake into a stable fingerprint, so you can recognize a specific client — or a specific piece of malware — even though the traffic is encrypted, the way you'd recognize a browser by its user-agent. Pivot on a fingerprint to find every other flow from the same software.
  • 🚨 Catch malware calling home — built-in detection for C2 beaconing (regular, low-jitter check-ins), port scans, and DNS tunneling runs in the background with zero setup. A critical alert auto-freezes the recorder so the evidence is already saved when you look.
  • ⚙️ Name the process behind every connection — maps each socket to the program that opened it from ss/lsof, with an optional kernel-level eBPF kprobe (Linux, the ebpf feature) that also catches short-lived flows polling can miss. Works everywhere; the kprobe is an enhancement, not a requirement.
  • 📡 Decode the protocols, not just the ports — real L7 parsing of TLS, QUIC, HTTP, and DNS (plus an SSH banner/version sniff) and a dozen more, with per-flow stream tracking and handshake timing — so you see api.github.com and the JA4 fingerprint, not just "port 443."
  • 🎥 Freeze the evidence — arm a rolling recorder and freeze any incident into a portable bundle: the packets plus the connections, DNS, health, and alerts that explain them. Built for bug reports and post-mortems.
  • 🛡️ Safe by design — after setup, NetWatch drops its privileges and locks itself into a Landlock filesystem allow-list (Linux). A tool that parses hostile traffic cannot read your SSH keys, browser profiles, or /etc/shadow.
  • 🪟 Scales down to one screen--lite answers "what's using my network, and is my connection OK?" on a single 80×24 screen with six keys, so it fits an SSH session to a Pi or a tmux split. One keypress escalates to the full forensics view with the collectors already warm.

No config files. No setup. No flags required.

Install

brew install netwatch                 # macOS / Linux
nix-shell -p netwatch                 # NixOS / Nix
paru -S netwatch-tui-bin              # Arch (prebuilt; netwatch-tui builds from source)
scoop install netwatch                # Windows
cargo install netwatch-tui            # anywhere with Rust

Or grab a pre-built binary from Releases.

Windows needs Npcap installed — the installer's defaults are fine, and without it NetWatch exits at startup saying so. Building from source (cargo install, paru -S netwatch-tui) needs libpcap's development headers: libpcap-dev on Debian/Ubuntu and Alpine, libpcap-devel on Fedora/RHEL, libpcap on Arch. Missing them shows up as cannot find -lpcap at link time. macOS ships libpcap; the -static Linux binaries below bundle it and need nothing installed.

The Nix, Arch and Scoop packages are maintained by community packagers — thank you. File packaging issues with them; file netwatch bugs here. If a package lags a release, the Repology page shows it.

All platforms & build-from-source
PlatformDownload
Linux (x86_64, Debian/Ubuntu)netwatch-linux-x86_64.tar.gz
Linux (aarch64, Debian/Ubuntu)netwatch-linux-aarch64.tar.gz
Linux (x86_64, static — Arch/Fedora/Alpine/any distro)netwatch-linux-x86_64-static.tar.gz
Linux (aarch64, static — Arch/Fedora/Alpine/any distro)netwatch-linux-aarch64-static.tar.gz
macOS (Intel)netwatch-macos-x86_64.tar.gz
macOS (Apple Silicon)netwatch-macos-aarch64.tar.gz
Windows (x86_64)netwatch-windows-x86_64.exe.zip

The -static Linux builds bundle libpcap and have no runtime dependencies — use these on Arch, Fedora, Alpine, or any distro where the default builds report libpcap.so.0.8: cannot open shared object file.

The Windows build requires Npcap — install it before first run. The installer's defaults are fine: NetWatch looks in System32\Npcap, where Npcap actually puts wpcap.dll, so Install Npcap in WinPcap API-compatible Mode is not needed. With no Npcap at all you get a NetWatch message naming what's missing, not a Windows error box. (On v0.29.1 and earlier you did need that checkbox — see #47.)

From source:

git clone https://github.com/matthart1983/netwatch.git && cd netwatch
cargo build --release

Prerequisites: Rust 1.70+ and libpcap's development headers. The same applies to cargo install netwatch-tui.

PlatformInstall
Debian / Ubuntusudo apt install libpcap-dev
Fedora / RHELsudo dnf install libpcap-devel
Archsudo pacman -S libpcap
Alpinesudo apk add libpcap-dev
macOSincluded with the system
WindowsNpcap — the build fetches the Npcap SDK automatically, or set NPCAP_SDK to an extracted copy

Without them the build fails at link time with /usr/bin/ld: cannot find -lpcap. If you only want to run NetWatch rather than build it, the -static Linux binaries above need none of this.

Quick start

netwatch            # interface stats, connections, config — no privileges needed
sudo netwatch       # full mode — adds live packet capture + health probes

That's it. Switch tabs with 19, press ? for help, q to quit. The Dashboard is useful in five seconds; everything below is there when you need to go deeper.

Linux without sudo: grant the capture capabilities once and run as your normal user — sudo setcap 'cap_net_raw,cap_bpf,cap_perfmon+eip' "$(which netwatch)". Re-run it after every upgrade (details).

See it decrypt TLS in 60 seconds

The fastest way to understand what NetWatch is — watch it read the plaintext of a TLS 1.3 session you control:

sudo netwatch                                              # 1. launch, then open the Packets tab (4)
SSLKEYLOGFILE=/tmp/sslkeylog.txt curl https://example.com  # 2. any client that exports its keys
#                                                            3. filter the Packets tab with:  decrypted:true

The decrypted application data renders inline. A keylog miss never breaks capture — that record just stays opaque. (SSLKEYLOGFILE is the same mechanism Wireshark uses; it only works for traffic you control, never third-party or malware traffic.)

NetWatch decrypting a live TLS 1.3 session — the plaintext HTTP exchange decoded in the Packets tab

Reading the plaintext out of a live TLS 1.3 session — decrypted right in the terminal. No proxy, no man-in-the-middle.

See it catch egress drift in 60 seconds

The loop from the demo above, in three commands:

sudo netwatch                  # 1. launch and open the Egress tab (0). Leave it a minute
                               #    while it learns; each process grows a list of destinations
                               #    with hostnames, autonomous systems and ports
                               # 2. put the cursor on a process and press Enter — its observed
                               #    baseline becomes a rule in egress-policy.toml
curl https://example.org       # 3. same program, somewhere it has never been

The new destination lands with a ✗ drift verdict and an alert. Nothing was blocked — the point is that you were told.

The verdicts are deliberately not a binary:

✓ sni / ✓ ipMatched a declared hostname or address — precise
~ asnMatched only by autonomous system — that admits everything that AS operates, which for a hyperscaler is effectively unbounded
? echEncrypted ClientHello: the name is hidden by design, so this is "cannot judge", not "bad"
✗ driftOutside the allowlist
— no ruleThis program was never declared — nothing was checked
✗ undeclaredNo rule, under strict = true — the policy claims to be complete, so the absence is the finding

Rules accept exact hostnames, *.wildcards, autonomous systems, CIDR blocks (10.0.0.0/8), and ports. strict = true is what turns the linter from "tell me when my declared software misbehaves" into "tell me when something I never declared starts talking" — which is the shape an actual compromise has.

What you get

Ten tabs, switched with 19 and 0:

#TabWhat it shows
1DashboardInterfaces, bandwidth graph, top connections, gateway/DNS health, latency heatmap. Useful in 5 seconds.
2ConnectionsEvery socket with its process + PID, protocol, state, GeoIP, and latency sparklines.
3InterfacesPer-interface IPv4/IPv6, MAC, MTU, RX/TX, errors, drops.
4PacketsLive capture with real L7 decode, TLS 1.3 decryption, JA4, per-flow stream tracking, filters, PCAP export.
5StatsProtocol breakdown by bytes + TCP handshake-timing histogram.
6TopologyASCII map of machine → gateway → DNS → top hosts, with traceroute.
7TimelineConnection timeline color-coded by TCP state; security alerts land here.
8ProcessesPer-process bandwidth ranking with live RX/TX and connection counts.
9Insights(opt-in) feeds a snapshot to a local/cloud LLM for plain-language analysis.
0EgressLearns what each process talks to (hostname/AS/port), promotes that baseline to a policy with one keypress, then warns on drift. Observe-only, never blocks.

The Packets tab is where the forensics live — deep protocol decoding, live TLS 1.3 decryption, JA4 threat-hunting, Wireshark-style display filters, and incident capture. See the full feature reference →

Lite view

Ten tabs is an operator's instrument. When the question is just "what's using my network, and is my connection OK?" — one machine, an SSH session to a Pi, a tmux split — there's --lite:

netwatch --lite     # one screen, fits 80×24

NetWatch Lite: one 80×24 screen showing live throughput charts, gateway/DNS/internet reachability, and top talkers by process and host — expanding a connection in place and filtering it live

One screen, six keys. Live throughput, reachability, and who's talking — expand any row in place, filter as you type.

Everything on a single screen: live throughput charts, gateway/DNS/internet reachability, and the top talkers by process and host. Six keys — q quit, p pause, / filter, expand a talker, L back to the full view, ? help.

Press L from either view to switch. Both share the same collectors, so escalating from "something looks off" to the full ten-tab forensics view costs one keypress — no restart, no lost history, capture still running.

Dense view

The other direction: when you have a big terminal and want everything at once, --view dense fills it with four boxes and no chrome — no header bar, no menu bar, no status bar. Identity, sort state, page range and every keybind live inside the box borders, so every row carries data. It needs 130×44 as a floor and grows into whatever you give it: wider means more history in the plots and room for full hostnames, taller means more interfaces and more connections.

netwatch --view dense     # four boxes, needs 130×44

That's the screen at the top of this README. The signature element is the mirrored dual graph: download grows up from a centre time axis, upload grows down from the same axis. Traffic symmetry becomes a shape you recognise without reading a number — a download burst is a cliff above the line, a backup job is a cliff below it. Both halves are braille at two samples per character cell, and every cell is coloured by its height in the graph rather than by which series it belongs to, so you see a spike's severity before you measure it against the axis.

Throughput ramps cool→bright because high bandwidth is busy, not bad — a saturated link during a backup is working. Only bounded values where high genuinely is bad — link saturation, latency budget per hop — get the green→amber→red treatment, and their meters colour by position along the bar, so the red zone is visible before you reach it.

Below the graph: per-interface rates with 60-second sparklines, four-hop latency budgets (gateway, DNS, internet, and the slowest peer you're actually talking to), and the connection table with the selected row's detail hoisted into the top of the same box — no new screen, no back button. The detail row carries kernel TCP state — cwnd, ssthresh, mss, rwnd — read straight from the kernel: inet_diag over netlink on Linux, the net.inet.tcp.pcblist64 sysctl on macOS. The two kernels disagree about units (Linux counts segments, BSD counts bytes), so macOS values are normalised against the MSS and the column means the same thing on both. Windows reads -- until GetPerTcpConnectionEStats is wired up.

V cycles full → lite → dense, or set it once under Settings → View. Below 130×44 it falls back to the same 80×24 grid Lite targets — which fills its area too — and it never scrolls sideways.

Deeper dives

GuideWhat's in it
Feature referenceEvery keybinding, the display-filter language, protocol decoder list, themes, and config options.
TLS 1.3 decryptionHow SSLKEYLOGFILE decryption works, supported cipher suites, and what it can and can't read.
Threat hunting with JA4Fingerprinting clients and pivoting across flows.
Security & the Landlock sandboxThe threat model, capability dropping, and the filesystem allow-list.
Egress policy lintingThe observe → promote → warn model, the rule language, strict mode, and the NDJSON export schema.
Flight RecorderArming, freezing, and the contents of an incident bundle.
AI InsightsOptional local/cloud LLM analysis (off by default).

How it works

Raw bytes → Ethernet → IPv4/IPv6/ARP → TCP/UDP/ICMP → L7 decoders
                                            ↓
                          Per-flow stream tracking · Handshake timing
                          TLS 1.3 decryption · JA4 · Threat detection
CollectormacOSLinux
Connectionslsof + PKTAP/proc/net/tcp + eBPF kprobe
Packetslibpcap (BPF)libpcap
Process attributionPKTAPlsof/ss polling, with optional eBPF kprobe overlay

Everything degrades gracefully: features that need elevated privileges show a clear message and fall back, never crash. Full architecture notes live in WIKI.md.

Siblings: SysWatch (system) and DiskWatch (disk) — same chrome, different surface. ESSH — a pure-Rust SSH client with the same TUI aesthetic; connects where NetWatch observes.

NetWatch Cloud — hosted fleet monitoring for the servers you run NetWatch against. A tiny Rust agent on each Linux host, a real-time dashboard, and email + Slack alerts on latency, packet loss, or hosts going offline. Free while we grow. The agent, SDK, and dashboard are MIT; the hosted backend is proprietary.

Thanks

Packagers. NetWatch is in homebrew-core, nixpkgs, the AUR and the Scoop main bucket — and I packaged none of it. Every one of those was done by someone who found the tool useful, did the work unasked, and has kept it current since. The Scoop entry has usually tracked a release within hours of the tag.

Dominiquininetwatch-tui on the AUR, since March 2026
kemelzaidannetwatch-tui-bin on the AUR
tomasriveranetwatch in nixpkgs
scillidannetwatch in the Scoop main bucket, since v0.15.3
Homebrew maintainersfor taking the formula into core, and the bot that has tracked every release since

Packaging is thankless work that only gets noticed when it breaks. If you install NetWatch through one of these, you have them to thank for it, not me.

Contributors. @lamchau, @fdncred and @PeteE have sent patches. Thank you — a pull request from a stranger is the best thing that happens to a project like this.

And to everyone who has opened an issue with a real repro, argued with a design decision, or told me the output was wrong on their terminal: that is the feedback loop this is built on.

Contributing

Questions, ideas, and bug reports are welcome in GitHub Discussions and Issues. See CONTRIBUTING.md for coding conventions and WIKI.md for the architecture guide.

License

MIT

Categories