
network-monitor v0.7.4
A real-time network connection monitoring tool built with Rust and GTK4, displaying active connections with live I/O statistics in a modern graphical interface.
Network Monitor
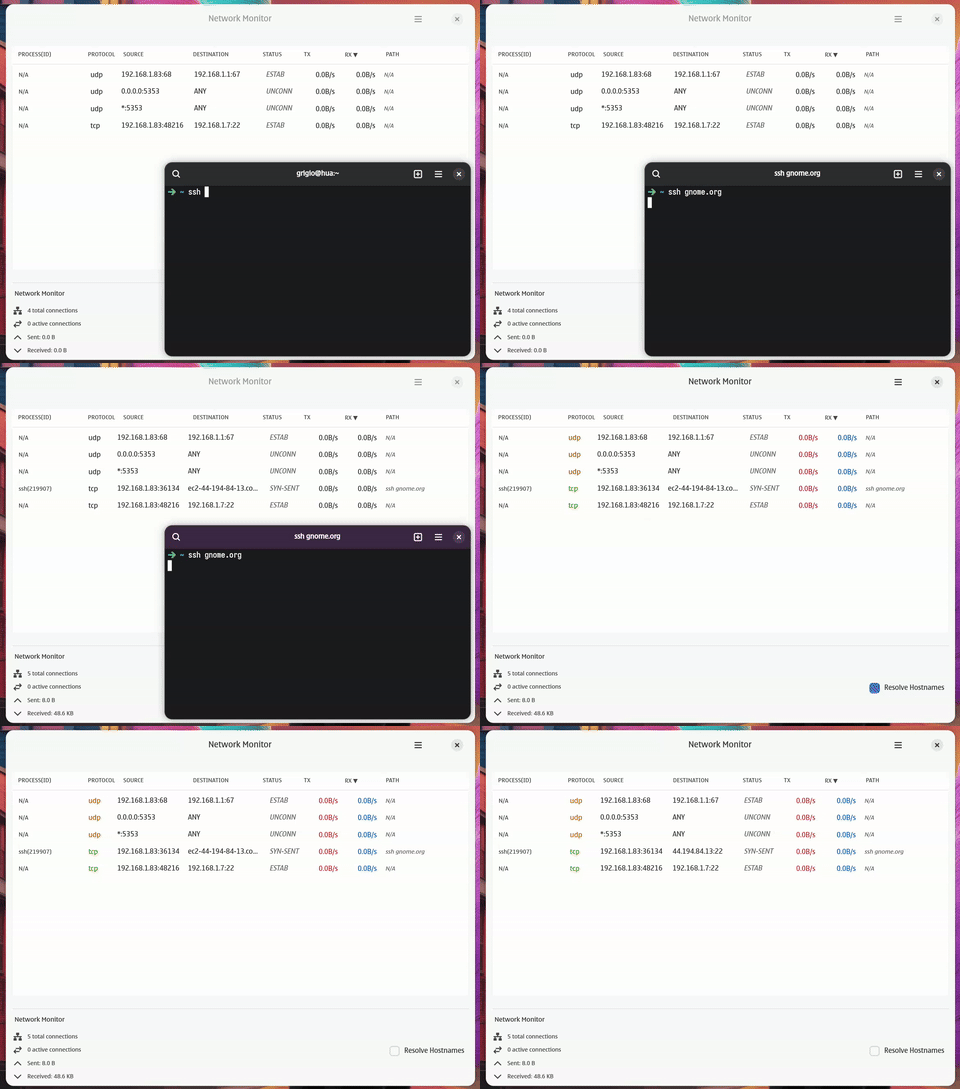
A real-time network connection monitoring tool built with Rust and GTK4, displaying active connections with live I/O statistics in a modern graphical interface.


Features
- Real-time monitoring: Continuously monitors active network connections
- I/O statistics: Shows live upload/download rates for each connection
- Process identification: Displays the program and PID associated with each connection
- Process actions: Right-click a row to copy its value/command or to kill the process that owns the connection (Terminate or Force Kill, with confirmation)
- Persistent selection: The selected row keeps its highlight across refreshes and is shown in the status strip
- Modern GTK4 UI: Clean, responsive graphical interface with Libadwaita styling
- Terminal UI (TUI): Interactive terminal interface with the same monitoring capabilities
- Address resolution: Simplifies common addresses (localhost, any, mDNS)
- Connection filtering: Filters out localhost connections for cleaner output
- GNOME integration: Proper WM class support for dock pinning and desktop integration
- Dual installation: Supports both user-local and system-wide installation
- Robust error handling: Comprehensive error recovery with clear setup guidance
- Performance optimized: Process caching and layout caching for improved responsiveness
Requirements
- Rust 1.70+ (2021 edition)
- GTK4 development libraries
- Libadwaita development libraries
- Linux system with
/procfilesystem - Linux 5.8+ (for eBPF granular capabilities)
- Nightly Rust and
bpf-linker(for eBPF compilation)
Installation on Ubuntu/Debian:
sudo apt update
sudo apt install libgtk-4-dev libadwaita-1-dev
Installation on Fedora:
sudo dnf install gtk4-devel libadwaita-devel
Installation
Method 1: Install from source with desktop integration
- Clone the repository:
git clone <repository-url>
cd network-monitor
- Install locally (no sudo required):
./scripts/install.sh
- Or install system-wide (requires sudo):
sudo ./scripts/install.sh
The installation script will:
- Build both GTK4 and TUI binaries (debug for local, release for system-wide)
- Install binaries to
~/.local/bin/(local) or/usr/local/bin/(system-wide) - Install desktop file with proper WM class for GNOME dock pinning
- Install icons to appropriate icon directories
- Update icon cache and desktop database
- Ensure the application can be pinned to GNOME dock/dashboard
Method 2: Build and run directly
- Clone the repository:
git clone <repository-url>
cd network-monitor
- Build and run:
cargo run
Or build in release mode:
cargo build --release
./target/release/network-monitor
Method 3: Build and run the TUI version
- Clone the repository:
git clone <repository-url>
cd network-monitor
- Build and run the TUI:
cargo build --bin nmt
./target/debug/nmt
Or build in release mode:
cargo build --release --bin nmt
./target/release/nmt
Uninstallation
Remove installed version
Local installation removal:
./scripts/uninstall.sh
System-wide removal (requires sudo):
sudo ./scripts/uninstall.sh
The uninstallation script will remove the binary, desktop file, and icons from the appropriate locations and update all relevant caches.
Usage
GTK4 Graphical Interface
Launch the network monitor application:
cargo run
The application will open a GTK4 window displaying:
- Process(ID): Process name and PID with accurate socket-to-process mapping
- Protocol: TCP/UDP protocol
- Source: Local endpoint (resolved to readable format)
- Destination: Remote endpoint (resolved to readable format)
- Status: Connection state (ESTABLISHED, LISTEN, etc.)
- TX: Upload rate calculated from process I/O statistics
- RX: Download rate calculated from process I/O statistics
- Path: Full command path and arguments from
/proc/[pid]/cmdline
Row actions
- Left click: select a row (also shown in the bottom strip)
- Right click: open the context menu with Copy Value, Copy Command and Kill "process" (PID), which asks whether to Terminate (SIGTERM) or Force Kill (SIGKILL)
- Delete: kill the currently selected row (same confirmation dialog)
- Ctrl+C: copy the cell content
- Refresh button in the header bar: update immediately (the list also refreshes every 3s)
Terminal Interface (TUI)
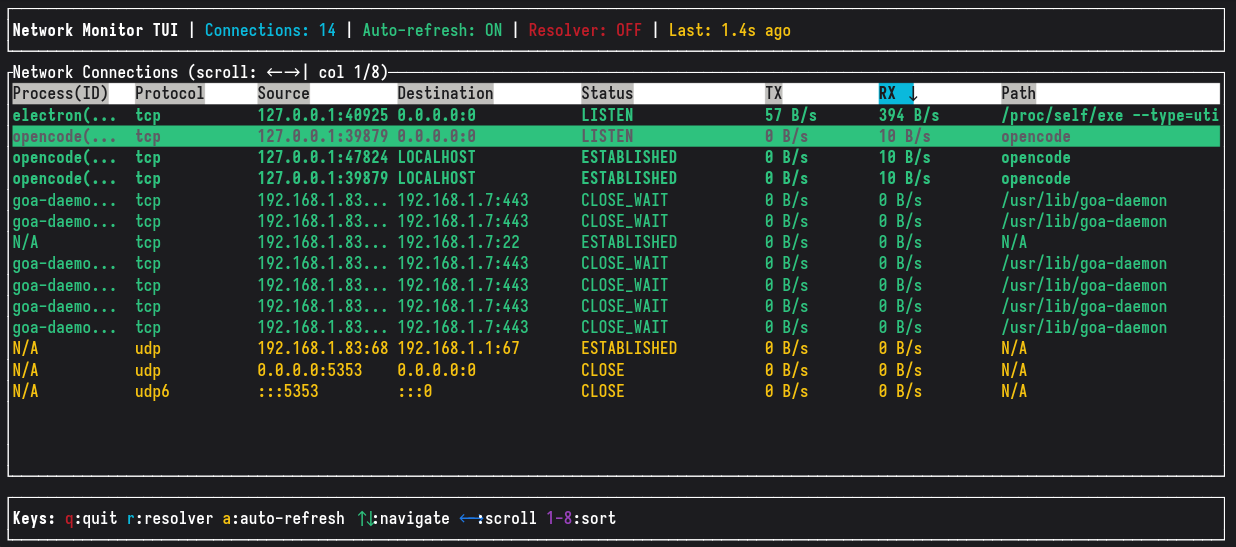
Launch the terminal interface:
cargo run --bin nmt
The TUI provides the same monitoring capabilities in an interactive terminal interface:
Key Controls:
q- Quit the applicationr- Toggle hostname resolutionR- Refresh connections manuallya- Toggle auto-refresh (2-second intervals)↑/↓- Navigate through connections←/→- Scroll table horizontallyk/ right click - Open the kill menu for a row (Terminate / Force Kill / Cancel)1-8- Sort by columns (Process(ID), Protocol, Source, Destination, Status, TX, RX, Path)
Mouse: left click selects a row, right click selects it and opens the kill menu.
Features:
- Real-time connection monitoring with auto-refresh
- Sortable columns with visual indicators
- Horizontal scrolling for wide tables
- Smart column sizing - last column gets full remaining width
- Color-coded protocols (TCP/TCP6 in green, UDP/UDP6 in yellow)
- Active connection highlighting
- Process and PID information
- Live I/O rate display
- Same column order as GTK4 version for consistency
Address Resolution
Common addresses are simplified for readability:
0.0.0.0:*or*:*→ANY127.0.0.1:*or[::1]:*→LOCALHOST224.0.0.251:*→MDNS
How It Works
eBPF Backend (event-driven)
The app uses kernel-level kprobes (tcp_v4_connect, tcp_v6_connect, tcp_close,
inet_csk_accept) instead of polling /proc/net. This provides:
- Event-driven: Sub-millisecond event delivery, no polling overhead (~1-3% CPU)
- Direct PID: Captured at probe point via
bpf_get_current_pid_tgid(), no inode scanning - Short-lived connections: Never missed between poll intervals
eBPF Mode
The eBPF backend provides event-driven connection monitoring with lower overhead and real-time
events, compared to the default /proc/net polling approach. It can capture short-lived connections
that polling might miss.
Prerequisites:
rustup toolchain install nightly
cargo install bpf-linker
Build and run:
cargo build
Run as normal user (kernel 5.8+ required):
Grant the required Linux capabilities to the binary once:
sudo setcap cap_bpf,cap_net_admin,cap_perfmon+ep target/debug/network-monitor
./target/debug/network-monitor
Or for the TUI version:
sudo setcap cap_bpf,cap_net_admin,cap_perfmon+ep target/debug/nmt
./target/debug/nmt
For release builds, adjust the path accordingly:
sudo setcap cap_bpf,cap_net_admin,cap_perfmon+ep target/release/network-monitor
The app will exit with a setup message if eBPF is unavailable (missing capabilities or unsupported kernel).