 grigio/network-monitor
A real-time network connection monitoring tool built with Rust and GTK4, displaying active connections with live I/O statistics in a modern graphical interface.

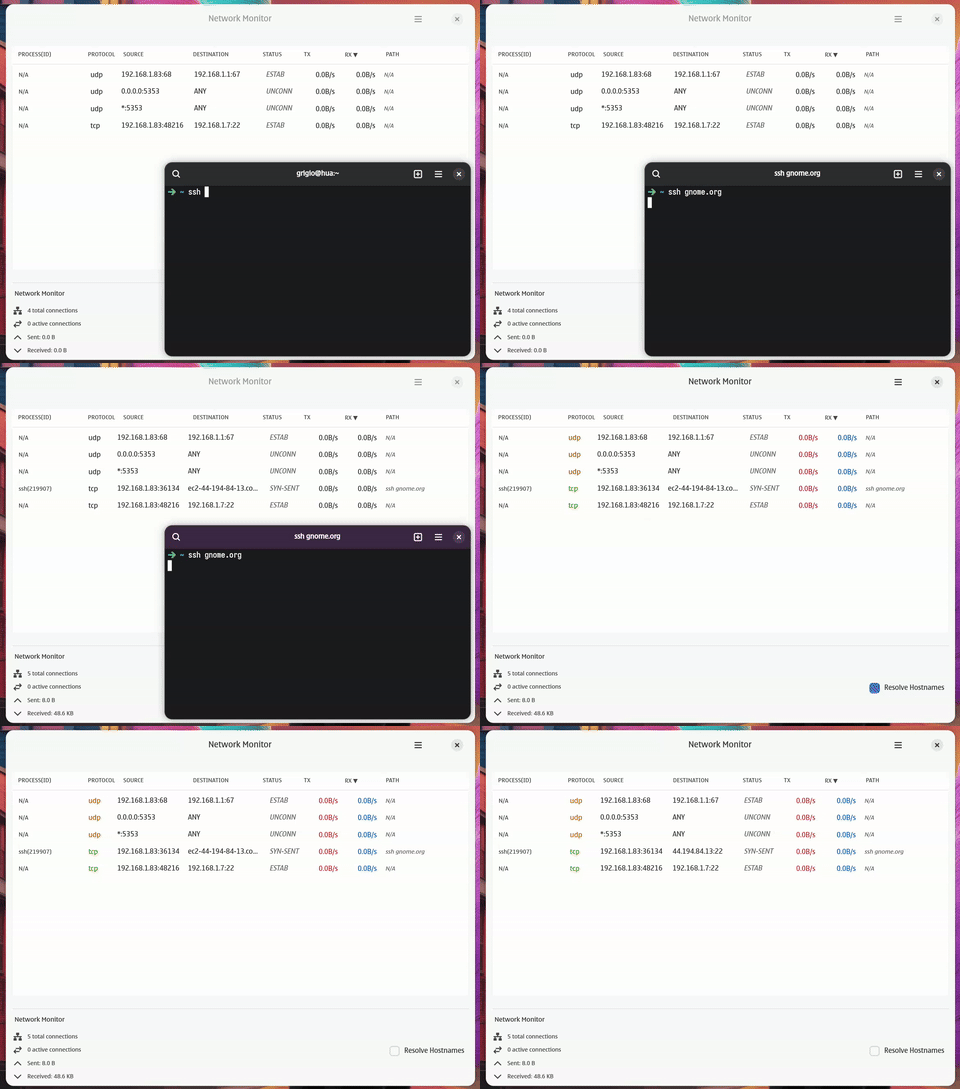
A real-time network connection monitoring tool built with Rust and GTK4, displaying active connections with live I/O statistics in a modern graphical interface.


/proc filesystembpf-linker (for eBPF compilation)sudo apt update
sudo apt install libgtk-4-dev libadwaita-1-dev
sudo dnf install gtk4-devel libadwaita-devel
git clone <repository-url>
cd network-monitor
./scripts/install.sh
sudo ./scripts/install.sh
The installation script will:
~/.local/bin/ (local) or /usr/local/bin/ (system-wide)git clone <repository-url>
cd network-monitor
cargo run
Or build in release mode:
cargo build --release
./target/release/network-monitor
git clone <repository-url>
cd network-monitor
cargo build --bin nmt
./target/debug/nmt
Or build in release mode:
cargo build --release --bin nmt
./target/release/nmt
Local installation removal:
./scripts/uninstall.sh
System-wide removal (requires sudo):
sudo ./scripts/uninstall.sh
The uninstallation script will remove the binary, desktop file, and icons from the appropriate locations and update all relevant caches.
Launch the network monitor application:
cargo run
The application will open a GTK4 window displaying:
/proc/[pid]/cmdline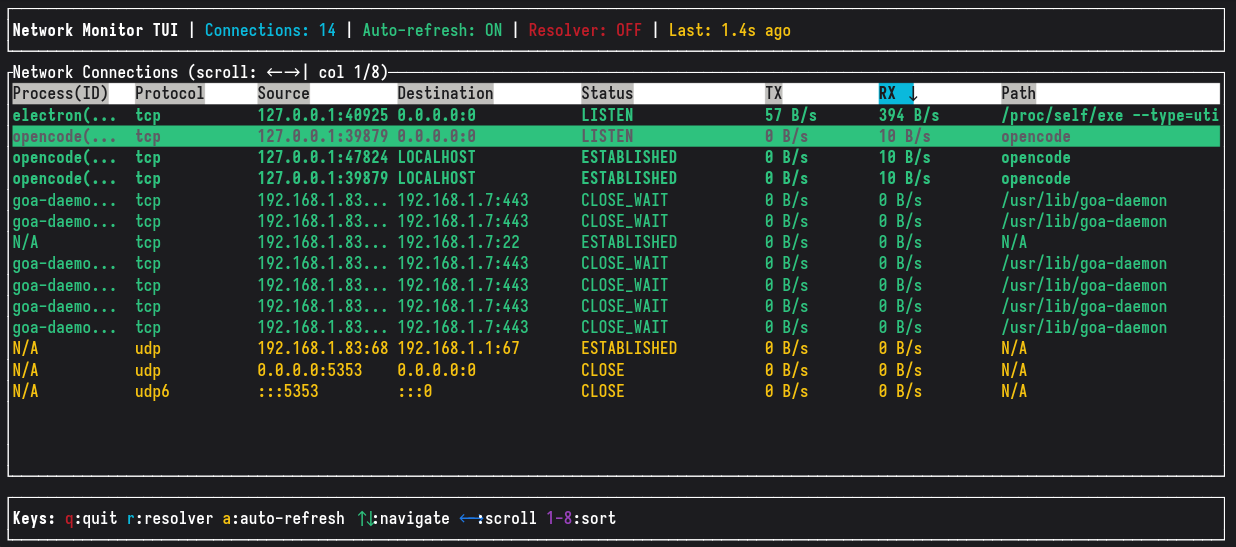
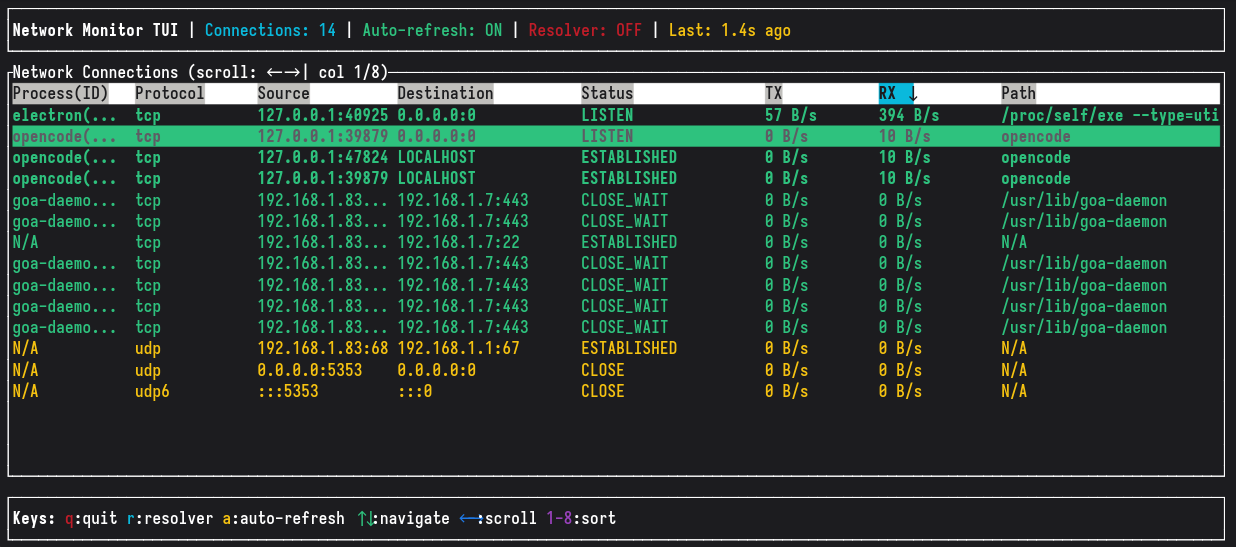
Launch the terminal interface:
cargo run --bin nmt
The TUI provides the same monitoring capabilities in an interactive terminal interface:
Key Controls:
q - Quit the applicationr - Manually refresh connectionsa - Toggle auto-refresh (2-second intervals)↑/↓ - Navigate through connections←/→ - Scroll table horizontally1-8 - Sort by columns (Process(ID), Protocol, Source, Destination, Status, TX, RX, Path)Features:
Common addresses are simplified for readability:
0.0.0.0:* or *:* → ANY127.0.0.1:* or [::1]:* → LOCALHOST224.0.0.251:* → MDNSThe app uses kernel-level kprobes (tcp_v4_connect, tcp_v6_connect, tcp_close,
inet_csk_accept) instead of polling /proc/net. This provides:
bpf_get_current_pid_tgid(), no inode scanningThe eBPF backend provides event-driven connection monitoring with lower overhead and real-time
events, compared to the default /proc/net polling approach. It can capture short-lived connections
that polling might miss.
Prerequisites:
rustup toolchain install nightly
cargo install bpf-linker
Build and run:
cargo build
Run as normal user (kernel 5.8+ required):
Grant the required Linux capabilities to the binary once:
sudo setcap cap_bpf,cap_net_admin,cap_perfmon+ep target/debug/network-monitor
./target/debug/network-monitor
Or for the TUI version:
sudo setcap cap_bpf,cap_net_admin,cap_perfmon+ep target/debug/nmt
./target/debug/nmt
For release builds, adjust the path accordingly:
sudo setcap cap_bpf,cap_net_admin,cap_perfmon+ep target/release/network-monitor
The app will exit with a setup message if eBPF is unavailable (missing capabilities or unsupported kernel).
bpf_get_current_pid_tgid() at the probe point/proc/[pid]/io reading for I/O statisticsthiserror
If you find this project helpful, please consider making a donation to support its development.
88LyqYXn4LdCVDtPWKuton9hJwbo8ZduNEGuARHGdeSJ79BBYWGpMQR8VGWxGDKtTLLM6E9MJm8RvW9VMUgCcSXu19L9FSvbc1q6mh77hfv8x8pa0clzskw6ndysujmr78j6se025This project is open source. See the LICENSE file for details.
