matthart1983/netwatch
Real-time network diagnostics in your terminal. One command, zero config, instant visibility.
Network diagnostics in your terminal.








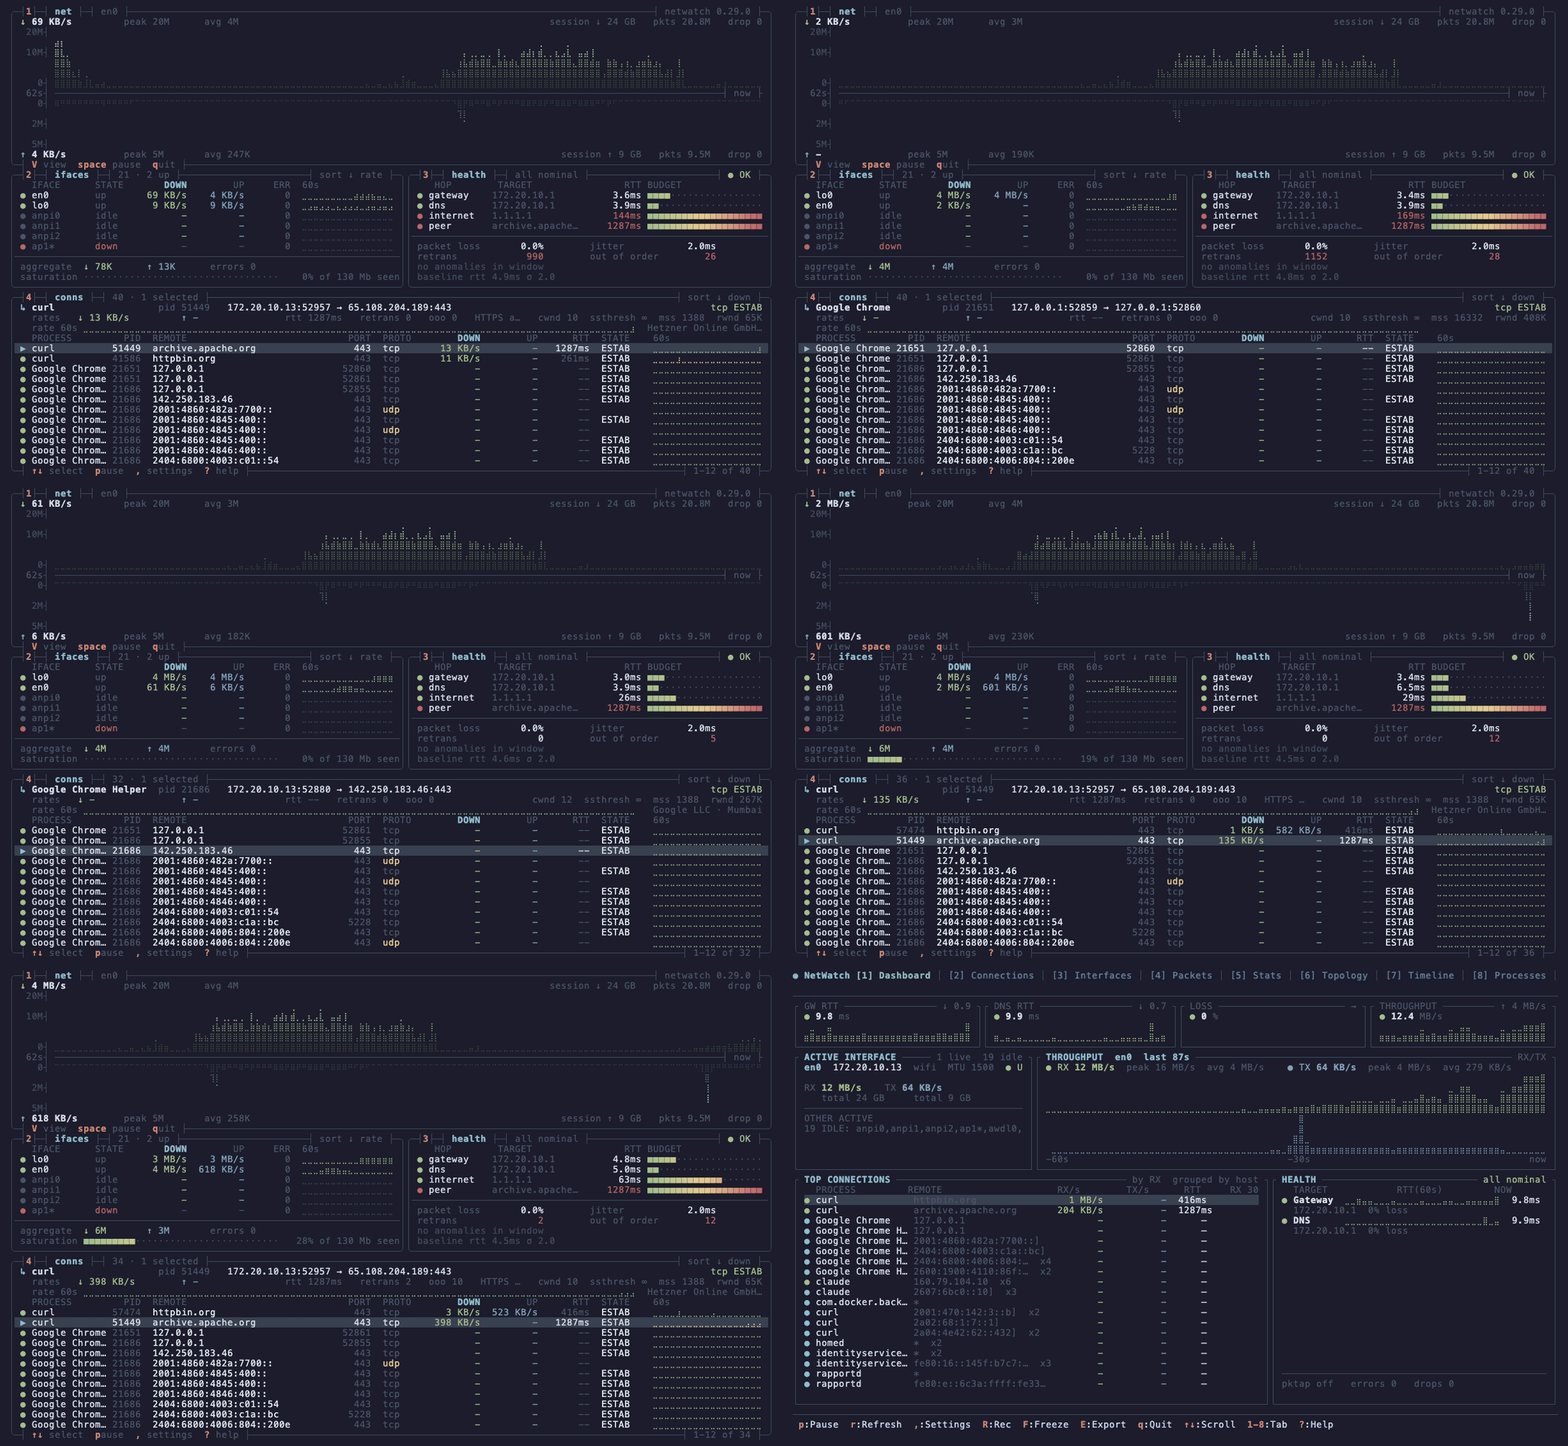
netwatch --view dense. Four boxes, no chrome, every keybind on a border. Download grows up from the axis, upload grows down.
One binary, no config. sudo netwatch and you have live capture with L7 decode, process attribution where available, and a diagnostic engine that opens an issue when a learned baseline breaks and closes it when the fix holds.
brew install netwatch                 # macOS / Linux
scoop install netwatch                # Windows (needs Npcap)
cargo binstall netwatch-tui           # prebuilt binary, anywhere with Rust
paru -S netwatch-tui                  # Arch (AUR)
nix-shell -p netwatch                 # NixOS / Nix
conda install -c conda-forge netwatch # conda / mamba (Linux, macOS)
Debian / Ubuntu (apt repository):
curl -fsSL https://matthart1983.github.io/netwatch/apt/netwatch.gpg \
  | sudo tee /usr/share/keyrings/netwatch.gpg >/dev/null
echo "deb [signed-by=/usr/share/keyrings/netwatch.gpg] \
https://matthart1983.github.io/netwatch/apt stable main" \
  | sudo tee /etc/apt/sources.list.d/netwatch.list
sudo apt update && sudo apt install netwatch
Fedora: sudo dnf copr enable matthart1983/netwatch && sudo dnf install netwatch
Container: docker run --rm -it --net=host --pid=host --cap-add=NET_RAW ghcr.io/matthart1983/netwatch
Binaries for macOS, Linux (x86_64, aarch64, armv5te) and Windows are on the
releases page, with
.deb, .rpm, checksums and signed provenance. The Linux builds are static and
need nothing installed; Windows needs Npcap.
Verifying a download ·
every channel.
netwatch              # interfaces, connections, config. No privileges.
sudo netwatch         # enables capture where elevated access is required
netwatch --lite       # one 80x24 screen
netwatch --view dense # four boxes, 130x44 or larger
1 to 9 and 0 switch tabs, V cycles the three views, ? shows every key. To run without sudo on Linux, grant the capabilities once: sudo setcap 'cap_net_raw,cap_bpf,cap_perfmon+eip' "$(which netwatch)" (why and when to repeat it).
| # | Tab | Shows |
|---|---|---|
| 1 | Dashboard | Latency tiles, mirrored throughput, the link carrying it, connections rolled up per process |
| 2 | Connections | Every socket with process, PID, state, GeoIP, RTT, retransmits |
| 3 | Interfaces | Addresses, MTU, rates, errors, drops |
| 4 | Packets | Live decode, TLS 1.3 decryption, JA4, stream tracking, display filters, PCAP export |
| 5 | Stats | Protocol breakdown and handshake-timing histogram |
| 6 | Topology | Machine, gateway, DNS, top hosts, traceroute |
| 7 | Timeline | Connections by TCP state, with alerts |
| 8 | Processes | Bandwidth per process |
| 9 | Diagnose | Issue, cause, fix, verified close. report.md from the same objects |
| 0 | Egress | Learned destinations, promoted policy, drift |
Every keybinding, display filters, decoders, themes, configuration.
V cycles all three without a restart; the collectors keep running.
| View | Size | For |
|---|---|---|
| Full | any | The ten tabs above |
Lite (--lite) | 80x24 | An SSH session to a Pi, or a tmux split |
Dense (--view dense) | 130x44+ | The hero image: four boxes, braille throughput, kernel TCP detail |