 purpleteam-labs/purpleteam-s2-containers
Stage two containers

These containers are started dynamically based on Build User config (Job) input supplied to the purpleteam CLI, specifically the number of testSessions you define.
The following configurations are relevant if you are intending on running the purpleteam back-end in the local environment. In the cloud this is all done for you.
Clone this repository.
We use a .env file directly in the app-slave directory for testing.
ZAP_API_KEY
Make sure you have assigned a value to the ZAP_API_KEY environment variable.
The ZAP_API_KEY can be what ever you chose, just make sure that as well as defining it for app-slave, you also add it to the app-scanner project configuration. The app-scanner project requires the Zap API Key to be configured in order to authenticate to Zap running in the Stage Two container. For the app-scanner project, this needs to be set in the following:
{ "slave": { "apiKey": <zap-api-key-here> } }
HOST_ZAP_LOG4J_PROPERTIES_PATH and ZAP_LOG4J_PROPERTIES_PATH_MOUNT_TARGET
If/when you need Zap debug logs you will also need to add the environment variables for the LOG4J debug configuration.
.env file
If you choose to use a .env file, adding all of these environment variables would look similar to the following:
ZAP_API_KEY=<zap-api-key-here>
HOST_ZAP_LOG4J_PROPERTIES_PATH=<absolute-path-to/purpleteam-s2-containers/app-slave/log4j.properties>
ZAP_LOG4J_PROPERTIES_PATH_MOUNT_TARGET=/home/zap/.ZAP/log4j.properties
Providing you have established the environment variables discussed above:
In order to turn on debug logging for the app-slave (Zap) containers that run in the local environment, uncomment the volumes array and the element containing source key with environment variable HOST_ZAP_LOG4J_PROPERTIES_PATH.
Details below for actually viewing the logs.
You can interact with Zap (query the Zap UI) while your tests are running. We've found this useful in the past to check the state of Zap while debugging the app-scanner.
docker stats
docker container ls
8080-8091 inclusive, as defined in the docker-compose.yml.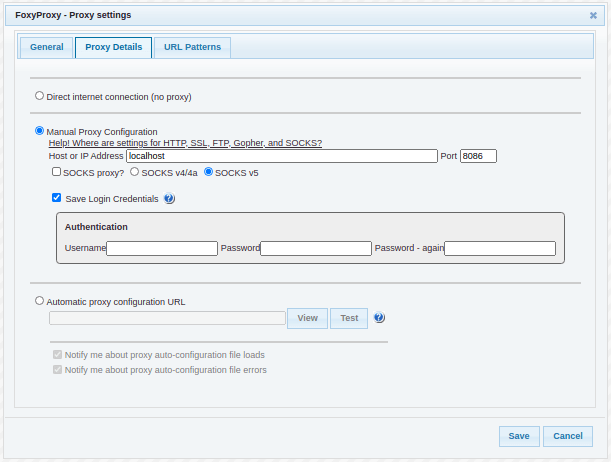
zap:8080/*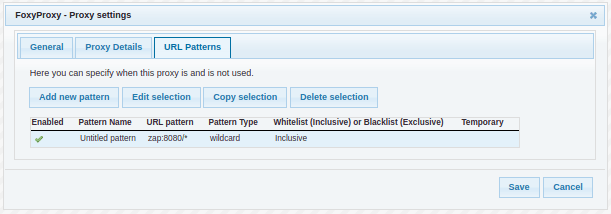
http://zap:8080/zap process in the container specified by host port in your FoxyProxy configurationIn order to turn on debug logging for the Selenium containers that run in the local environment, uncomment the environment array and the SE_OPTS=-debug element for chrome and/or firefox.
Details below for actually viewing the logs.
The following outlines what you will need to do in order to view the browser inside any of the Selenium containers run from this project.
-debug images. The -debug images may be commented out, so simply commenting out the usual image and uncommenting the image with -debug appended to the end should do the trick5900 port range. By specifying a range as the external port (Ex: 5900-5901) you will be able to VNC into more than one container at once, in the example we have allowed for opening two sessions concurrently. If you need to VNC into more than two simply widen the external port rangeYou will need a VNC client to open a connection to the VNC server within the container. We've had success with using the Remmina Remote Desktop Cleint on Linux Mint. Install Remmina-plugin-vnc via the Software Manager
Run your Remmina Remote Desktop Client
Create new entries. If you intend to VNC into a couple of Selenium containers concurrently, you could set each one up like the following:
| Key | Value |
|---|---|
| Name | seleniumstandalone_chrome_1 |
| Protocol | VNC - Virtual Network Computing |
| In the Basic tab | |
| Server | 127.0.0.1:5900 |
| Password | secret |
| Color depth | True color (24 bit) # This was the only one that worked for us |
| Quality | Poor (fastest) |
| Key | Value |
|---|---|
| Name | seleniumstandalone_chrome_2 |
| Protocol | VNC - Virtual Network Computing |
| In the Basic tab | |
| Server | 127.0.0.1:5901 |
| Password | secret |
| Color depth | True color (24 bit) # This was the only one that worked for us |
| Quality | Poor (fastest) |
Further details on the SeleniumHQ github
Once the Selenium containers are running (Keeping docker stats running in a terminal is convenient for viewing this), you can confirm which Selenium container is using which external port with docker container ls, as Docker has no idea which ports you have assigned to which of your VNC client entries, so the name of a given VNC client entry may not necessarily match the Selenium container with the same name. For this reason it is a good idea to confirm the port mappings with docker container ls.
In order to correlate which Selenium container is being used for which Test Session when you have multiple Test Sessions you may need to review the running app-scanner log. You may also need to make sure that the app-scanner is configured to log level debug in order to see some or more of the following log messages:
[app.parallel] cucCli process with PID "28" has been spawned for test session with Id "lowPrivUser"
[app.parallel] cucCli process with PID "34" has been spawned for test session with Id "adminUser"
[pid-28,world] seleniumContainerName is: seleniumstandalone_chrome_1
[pid-34,world] seleniumContainerName is: seleniumstandalone_chrome_2