
 unit8co/darts
A python library for user-friendly forecasting and anomaly detection on time series.











Darts is a Python library for user-friendly forecasting and anomaly detection
on time series. It contains a variety of models, from classics such as ARIMA to
deep neural networks. The forecasting models can all be used in the same way,
using fit() and predict() functions, similar to scikit-learn.
The library also makes it easy to backtest models,
combine the predictions of several models, and take external data into account.
Darts supports both univariate and multivariate time series and models.
The ML-based models can be trained on potentially large datasets containing multiple time
series, and some of the models offer a rich support for probabilistic forecasting.
Darts also offers extensive anomaly detection capabilities. For instance, it is trivial to apply PyOD models on time series to obtain anomaly scores, or to wrap any of Darts forecasting or filtering models to obtain fully fledged anomaly detection models.
We recommend to first setup a clean Python environment for your project with Python 3.11+ using your favorite tool (conda, venv, virtualenv with or without virtualenvwrapper).
Once your environment is set up you can install darts using pip:
pip install darts
For more details you can refer to our installation instructions.
Create a TimeSeries object from a Pandas DataFrame, and split it in train/validation series:
import pandas as pd
from darts import TimeSeries

# Read a pandas DataFrame
df = pd.read_csv("AirPassengers.csv", delimiter=",")

# Create a TimeSeries, specifying the time and value columns
series = TimeSeries.from_dataframe(df, "Month", "#Passengers")

# Set aside the last 36 months as a validation series
train, val = series[:-36], series[-36:]
Fit an exponential smoothing model, and make a (probabilistic) prediction over the validation series' duration:
from darts.models import ExponentialSmoothing

model = ExponentialSmoothing()
model.fit(train)
prediction = model.predict(len(val), num_samples=1000)
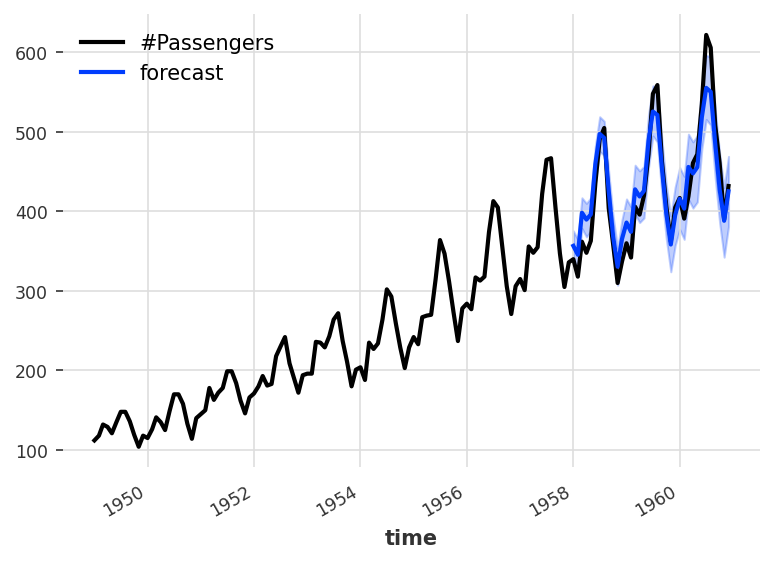
Plot the median, 5th and 95th percentiles:
import matplotlib.pyplot as plt

series.plot()
prediction.plot(label="forecast", low_quantile=0.05, high_quantile=0.95)
plt.legend()
Load a multivariate series, trim it, keep 2 components, split train and validation sets:
from darts.datasets import ETTh2Dataset

series = ETTh2Dataset().load()[:10000][["MUFL", "LULL"]]
train, val = series.split_before(0.6)
Build a k-means anomaly scorer, train it on the train set and use it on the validation set to get anomaly scores:
from darts.ad import KMeansScorer

scorer = KMeansScorer(k=2, window=5)
scorer.fit(train)
anom_score = scorer.score(val)
Build a binary anomaly detector and train it over train scores, then use it over validation scores to get binary anomaly classification:
from darts.ad import QuantileDetector

detector = QuantileDetector(high_quantile=0.99)
detector.fit(scorer.score(train))
binary_anom = detector.detect(anom_score)
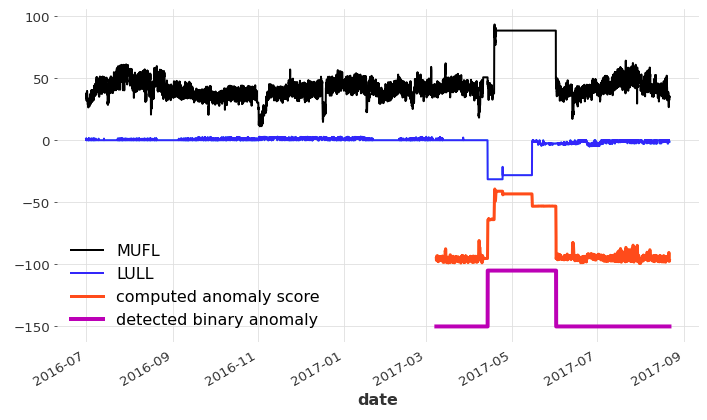
Plot (shifting and scaling some of the series to make everything appear on the same figure):
import matplotlib.pyplot as plt

series.plot()
(anom_score / 2. - 100).plot(label="computed anomaly score", c="orangered", lw=3)
(binary_anom * 45 - 150).plot(label="detected binary anomaly", lw=4)
Forecasting Models: A large collection of forecasting models for regression as well as classification tasks; from statistical models (such as ARIMA) to deep learning models (such as N-BEATS). See the forecasting models below.
Anomaly Detection The darts.ad module contains a collection of anomaly scorers,
detectors and aggregators, which can all be combined to detect anomalies in time series.
It is easy to wrap any of Darts forecasting or filtering models to build
a fully fledged anomaly detection model that compares predictions with actuals.
The PyODScorer makes it trivial to use PyOD detectors on time series.
Multivariate Support: TimeSeries can be multivariate - i.e., contain multiple time-varying
dimensions/columns instead of a single scalar value. Many models can consume and produce multivariate series.
