Skip to content
KitploitKITPLOIT
ToolsBlog
Submit
ToolsBlog
Submit

Hacking, PenTest, and Cybersecurity Tools for Your Security Arsenal!

Kitploit is a directory of hacking, cybersecurity, and pentesting tools. Discover the latest project updates to find vulnerabilities, analyze systems, automate testing, and strengthen your security.

··Feeds·Contact·Privacy·© 2026 Kitploit

Tool Directory

Categories

View all categories
Loading categories
Quantickle — A graphing toolkit for threat research - and other things | Kitploit
Tools/GitHubGitHub/rsac-labs/quantickle
OSINT (Open Source Intelligence)ReconnaissanceInformation GatheringUtilities & FrameworksThreat Intelligence
GitHubrsac-labs/quantickle

Quantickle

A graphing toolkit for threat research - and other things

View Repository
19525 months agoNot yet reviewed

Most Popular

View all →

Discover the most used tools by our community.

Explore all tools

Browse our collection of tools

View all tools →
Share

Quantickle - Network Graph Visualization for Threat Intelligence

q-mainheader


A browser-based network graph visualization tool built on Cytoscape.js. Quantickle helps visualize and analyze connected data of any type, but is faceted towards threat intelligence.

Installation

  • Install instructions

Table of Contents

  • Overview
  • Capabilities & Examples
  • Core Concepts
  • Data Model
    • Import & Export Formats
  • Layouts
  • Integrations
  • Workflows
  • Configuration
  • API
  • Storage
  • Troubleshooting
  • Project Structure
  • Additional Documentation

Disclaimer

This project was largely vibecoded, so take proper precautions. The code has been reviewed by real programmers, but is not hardened against vulnerabilities. Do not expose externally without a thorough security review.

Overview

Quantickle is an interactive, browser-first toolkit for building and exploring network graphs. The front-end (Cytoscape.js + custom UI) handles rendering, editing, and layout execution, while the lightweight Express server serves the UI, proxies integration calls, and optionally stores graphs in Neo4j. In other words, the browser owns the graph state and visualization, while the server exists to supply assets and integrations when needed.

✨ Key Features

  • Zero server-side storage by default: Graphs live in your browser until you export or sync via integrations.
  • Multiple data input methods:
    • CSV/edge list file upload
    • REST API integration
    • Direct data input
  • High performance:
    • WebGL rendering for large graphs
    • Progressive loading
    • Automatic performance optimization
  • Flexible visualization:
    • 20+ layout algorithms
    • Customizable node/edge styles
    • Markdown-enabled info field for nodes
    • Dynamic filtering
    • Graphs are chronology-aware (timeline layouts, timestamp coloring)
  • Edge curve styles:
    • The edge editor exposes curved (bezier), straight, bundled (unbundled-bezier), taxi, and rounded taxi options.
    • Cytoscape also supports haystack and segments curve styles through custom styling.
  • Interactive interface:
    • Zoom/pan controls
    • Node dragging
    • Selection tools
    • Search functionality
    • Graph does not move when individual nodes move
    • Container nodes for grouping related elements
    • Add callouts and images for context
    • All surfaces can have customizable icons and backgrounds
  • Linkable graphs:
    • Add graph nodes to create a jump point to another graph
    • The target graph will display a "back" button
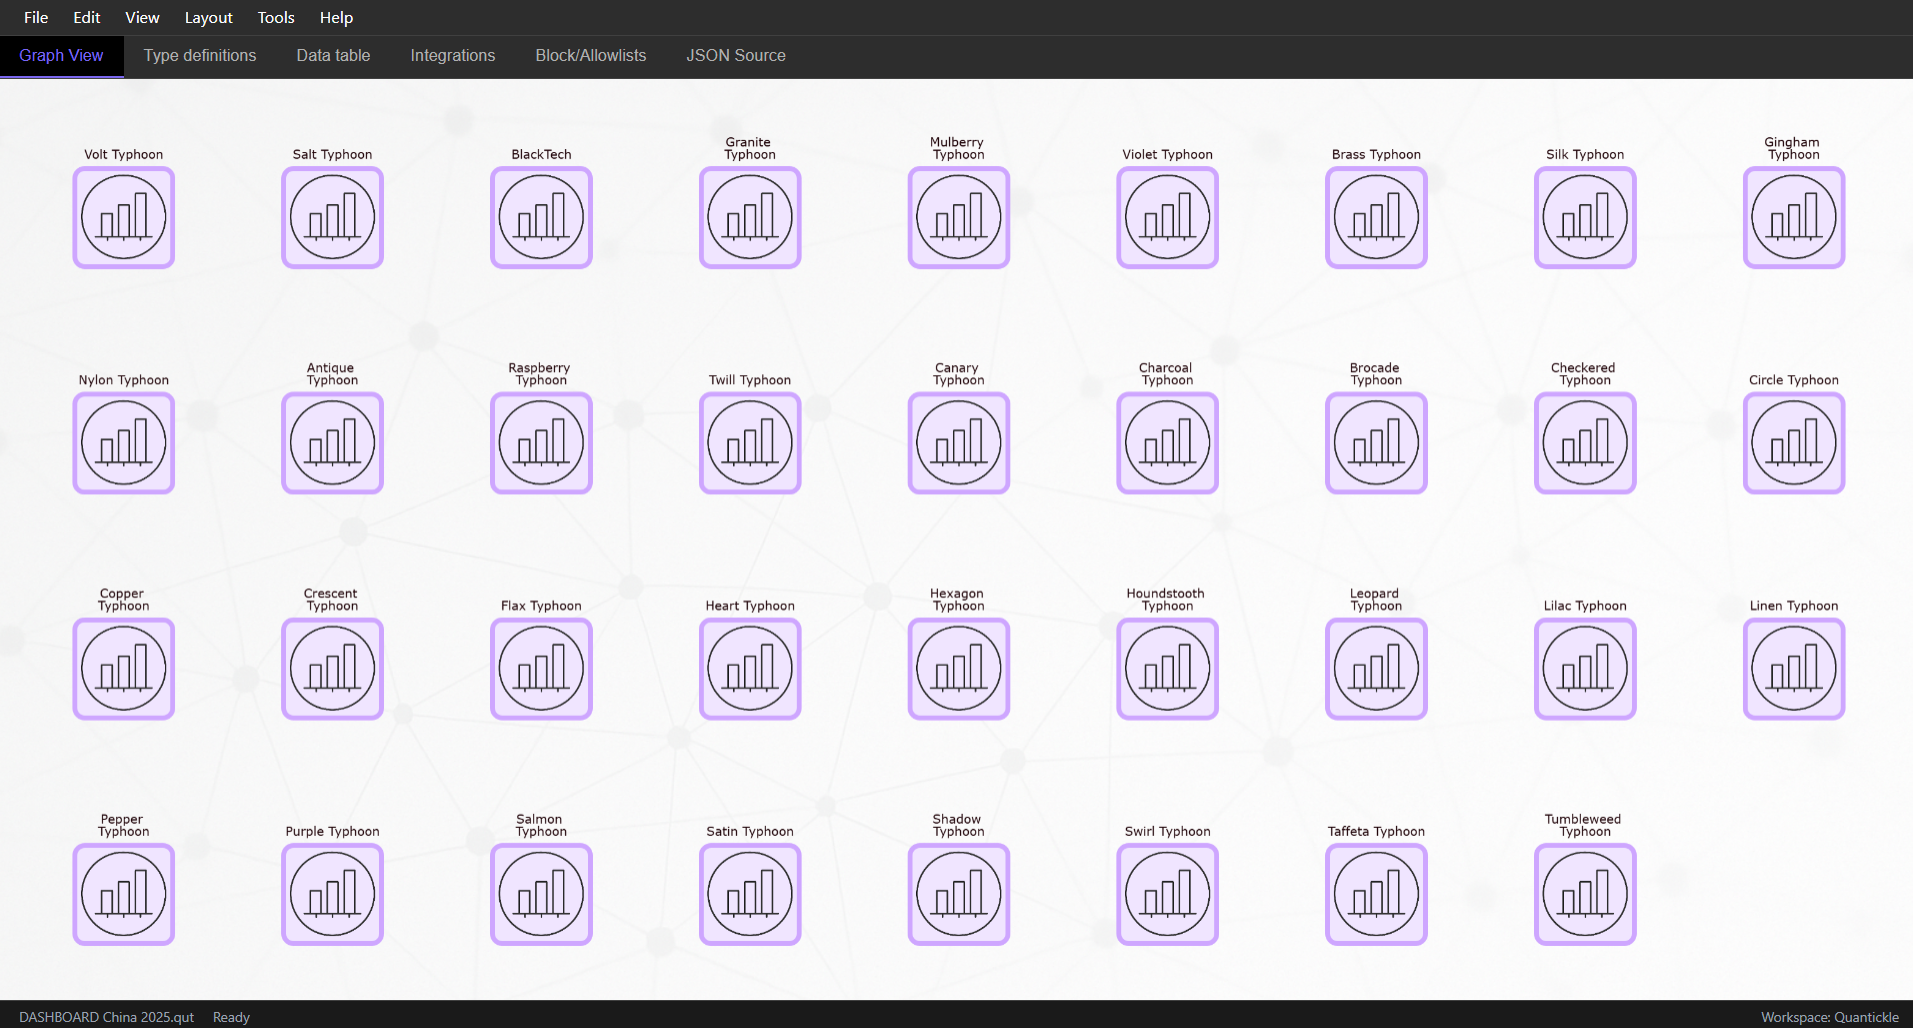
    • Chain graphs together in tree structures and dashboards

Capabilities & Examples

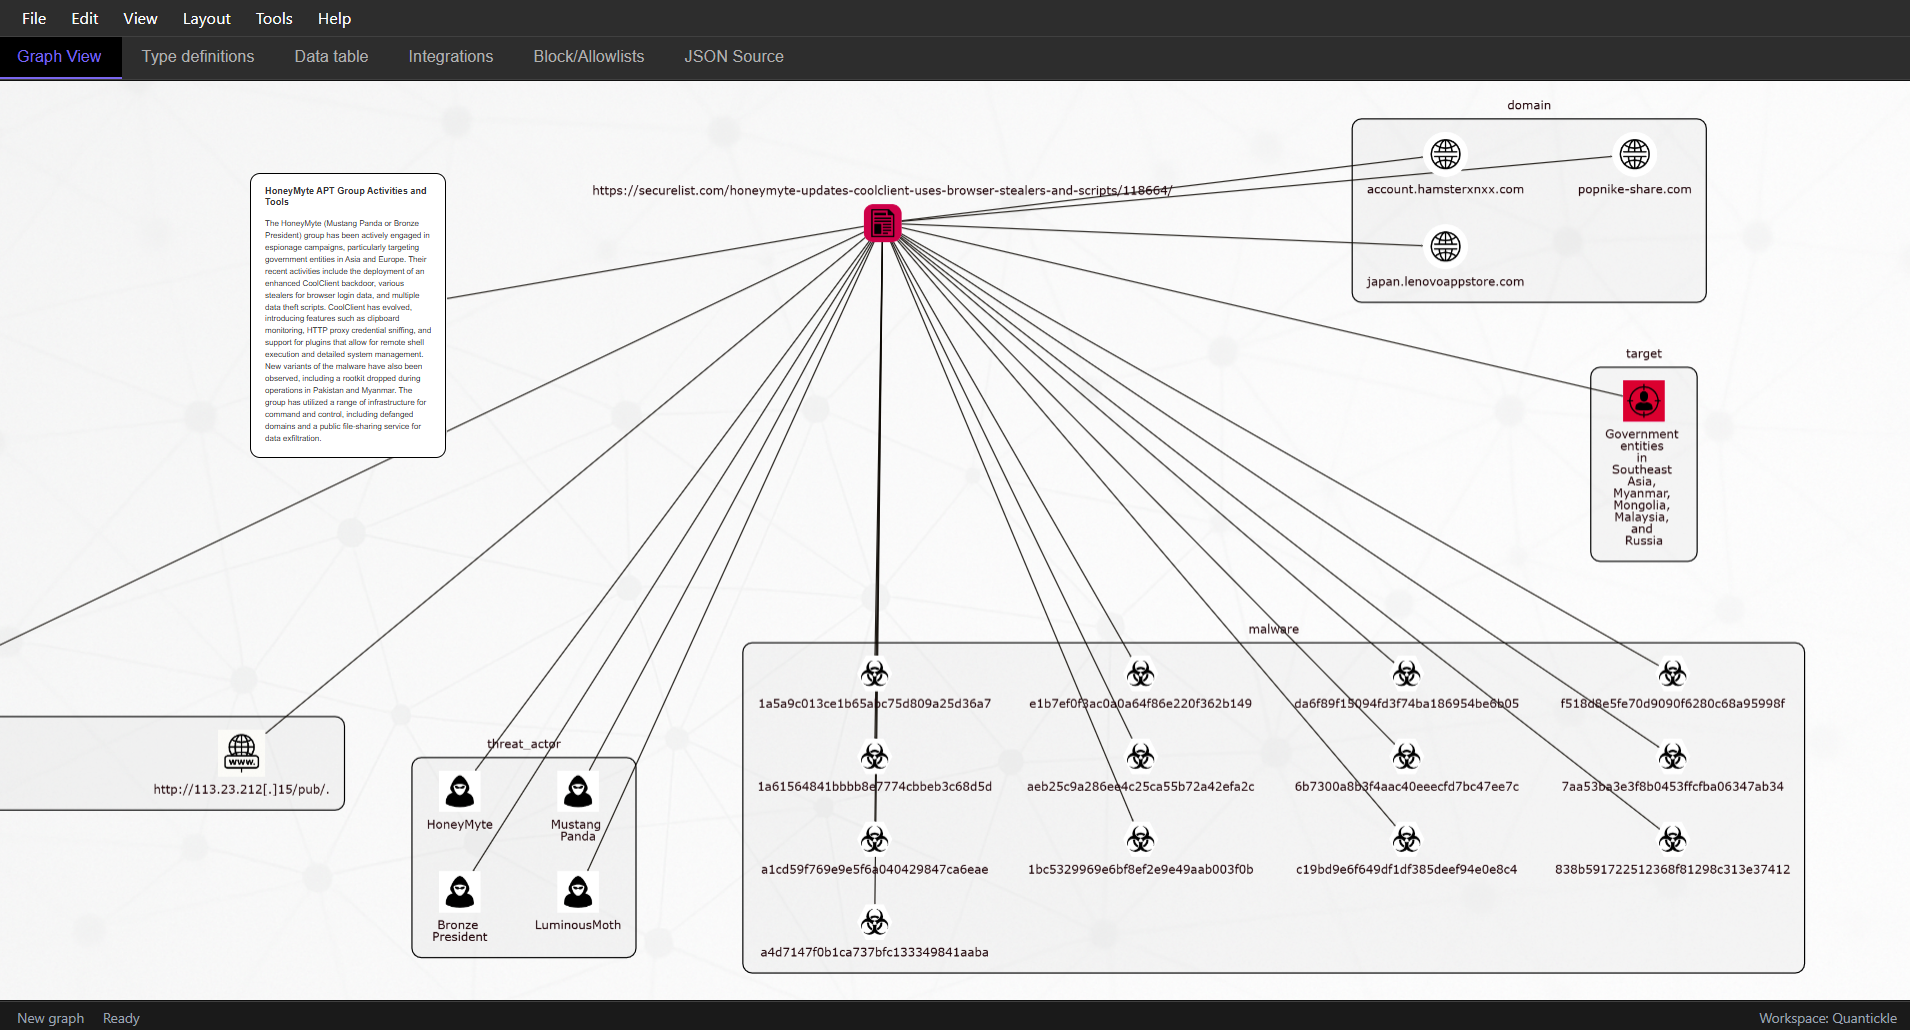
Here are some examples of what Quantickle can do:

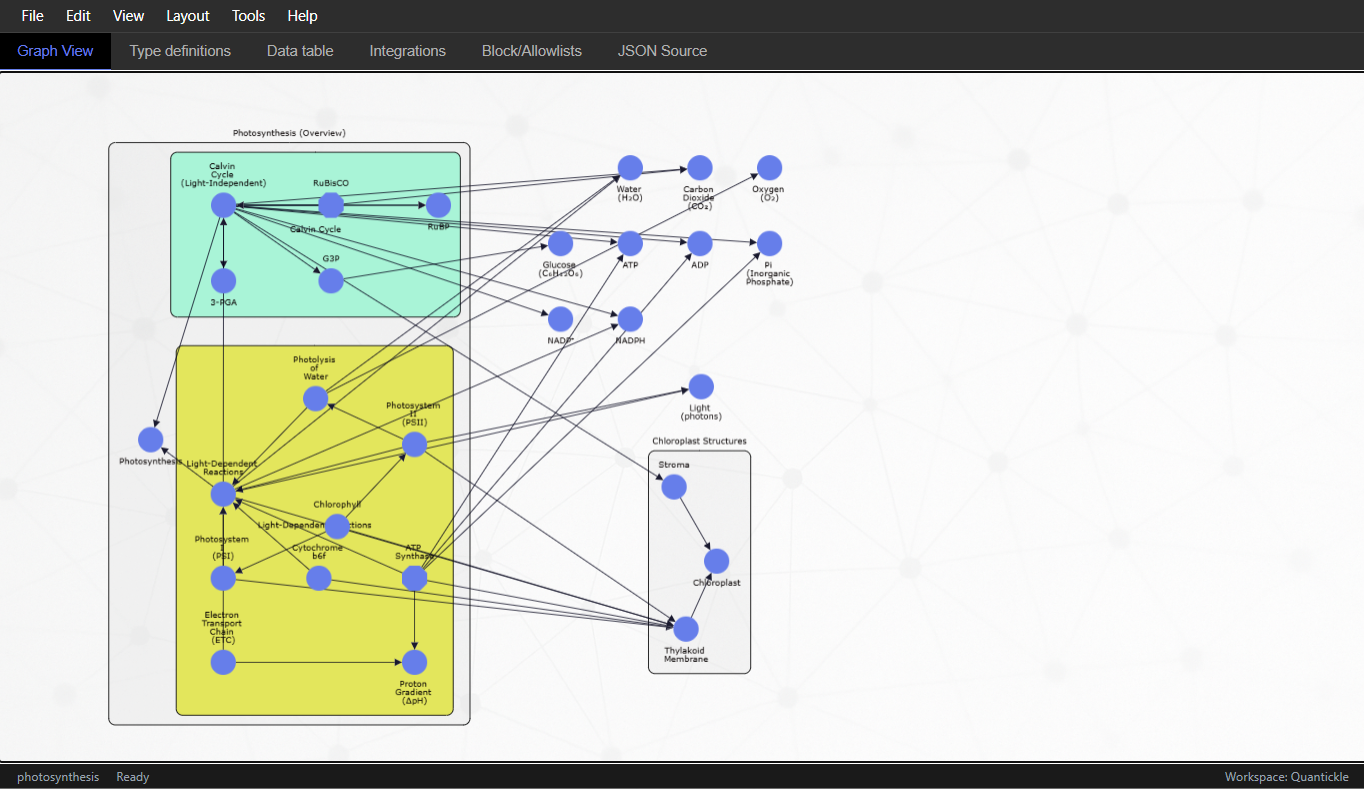
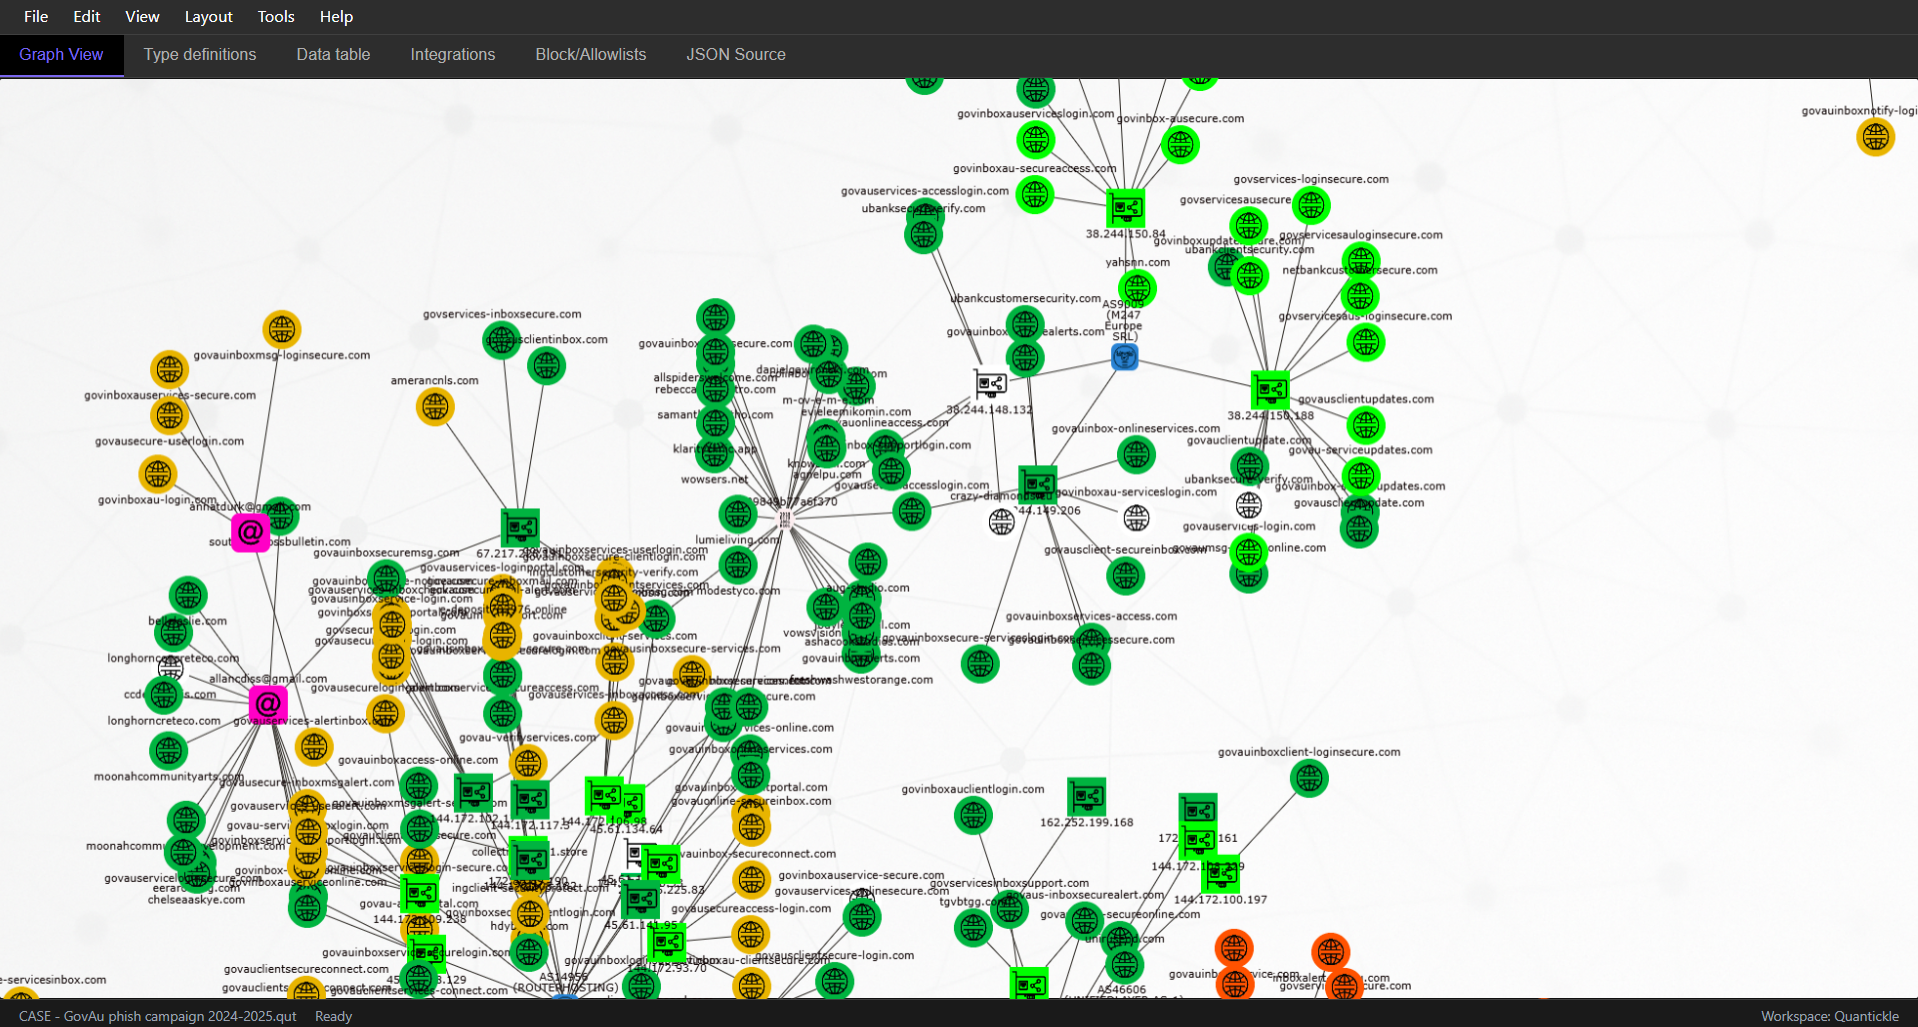
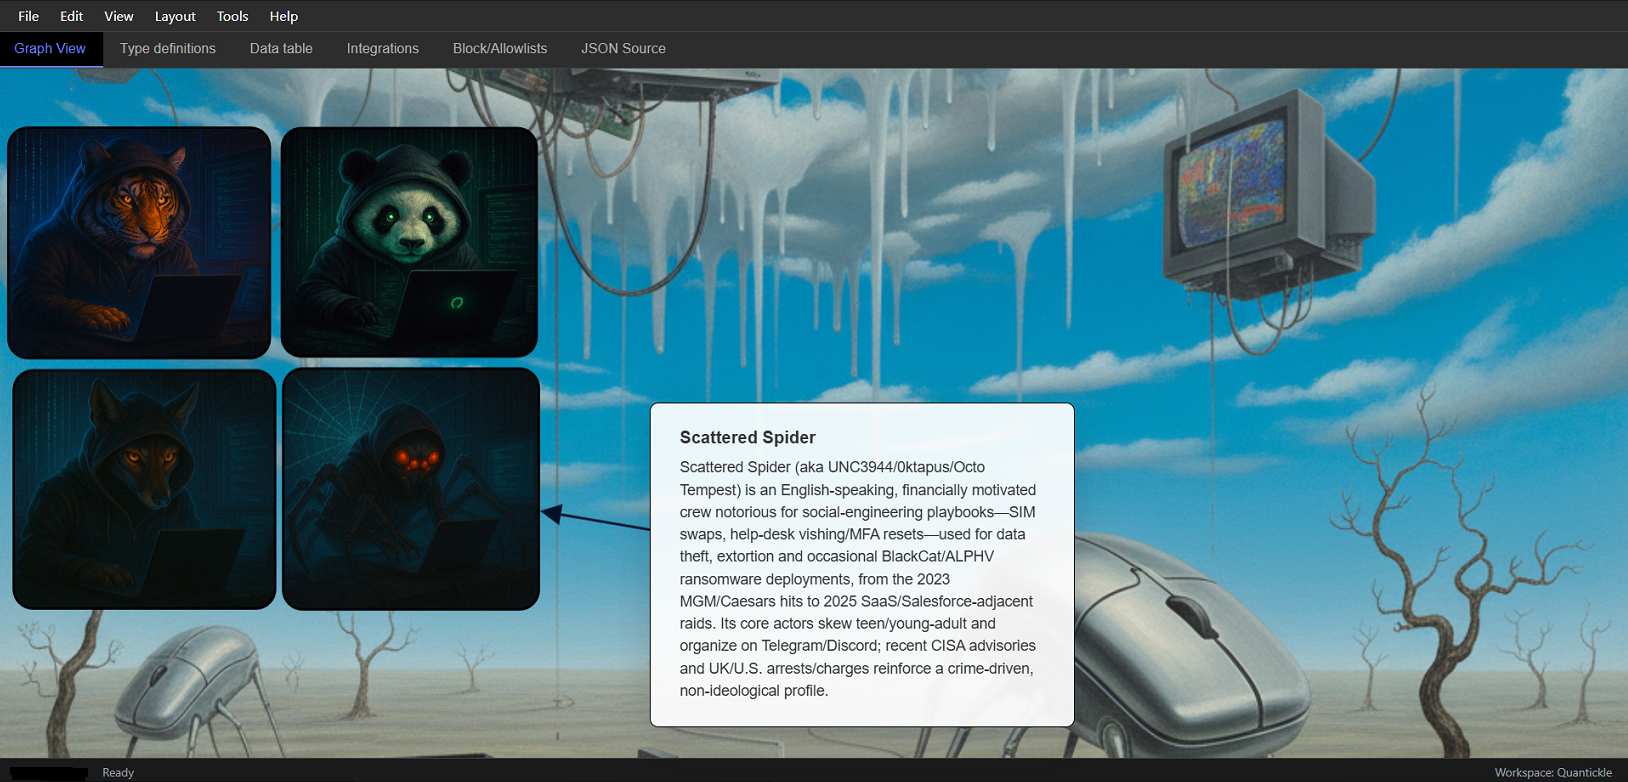
Customize everything: Backgrounds, icons, callouts, node & edge types, as well as areas of research
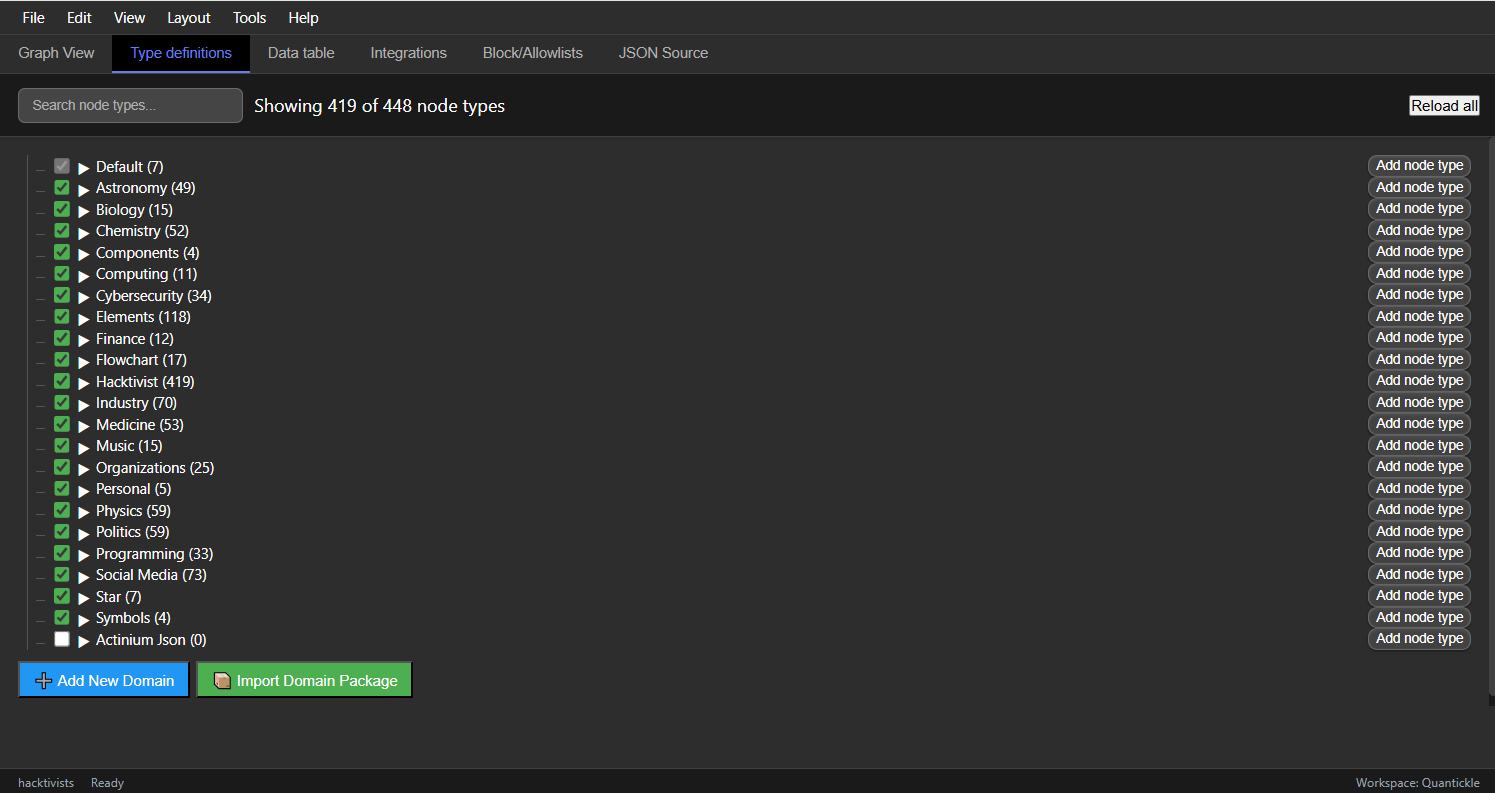
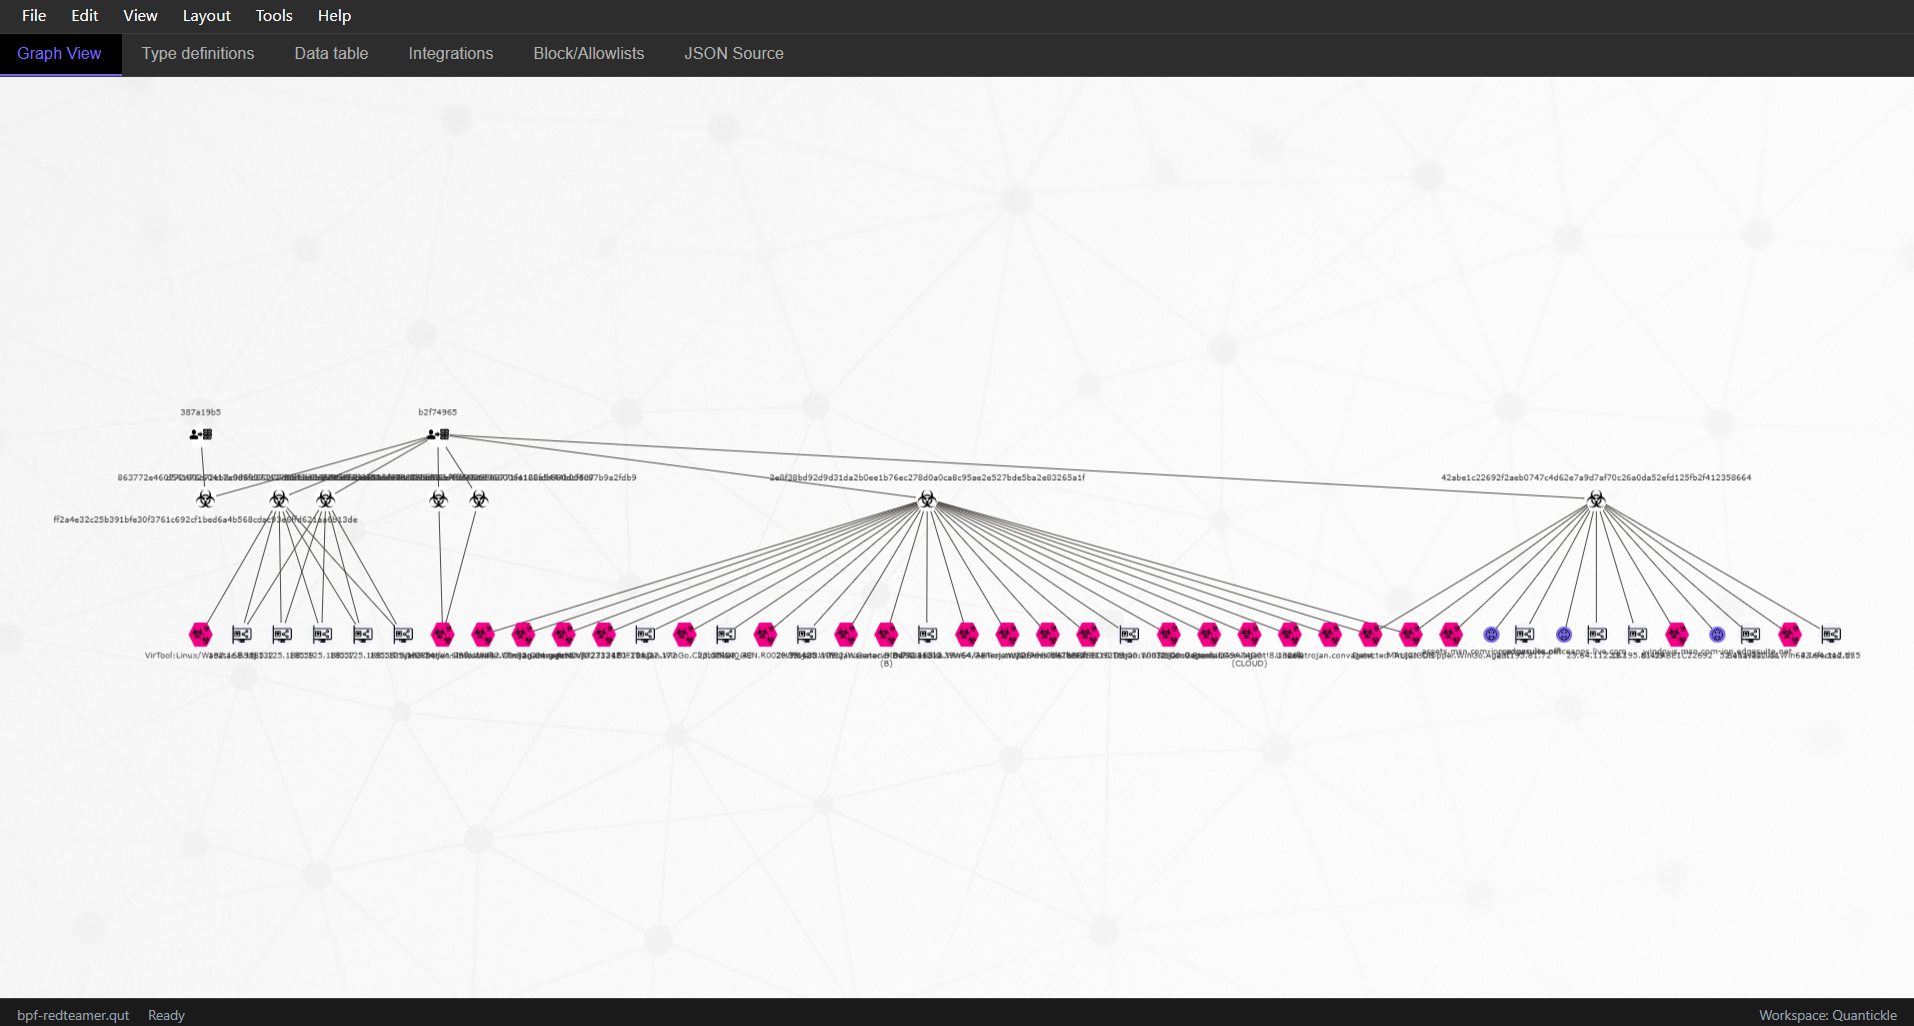
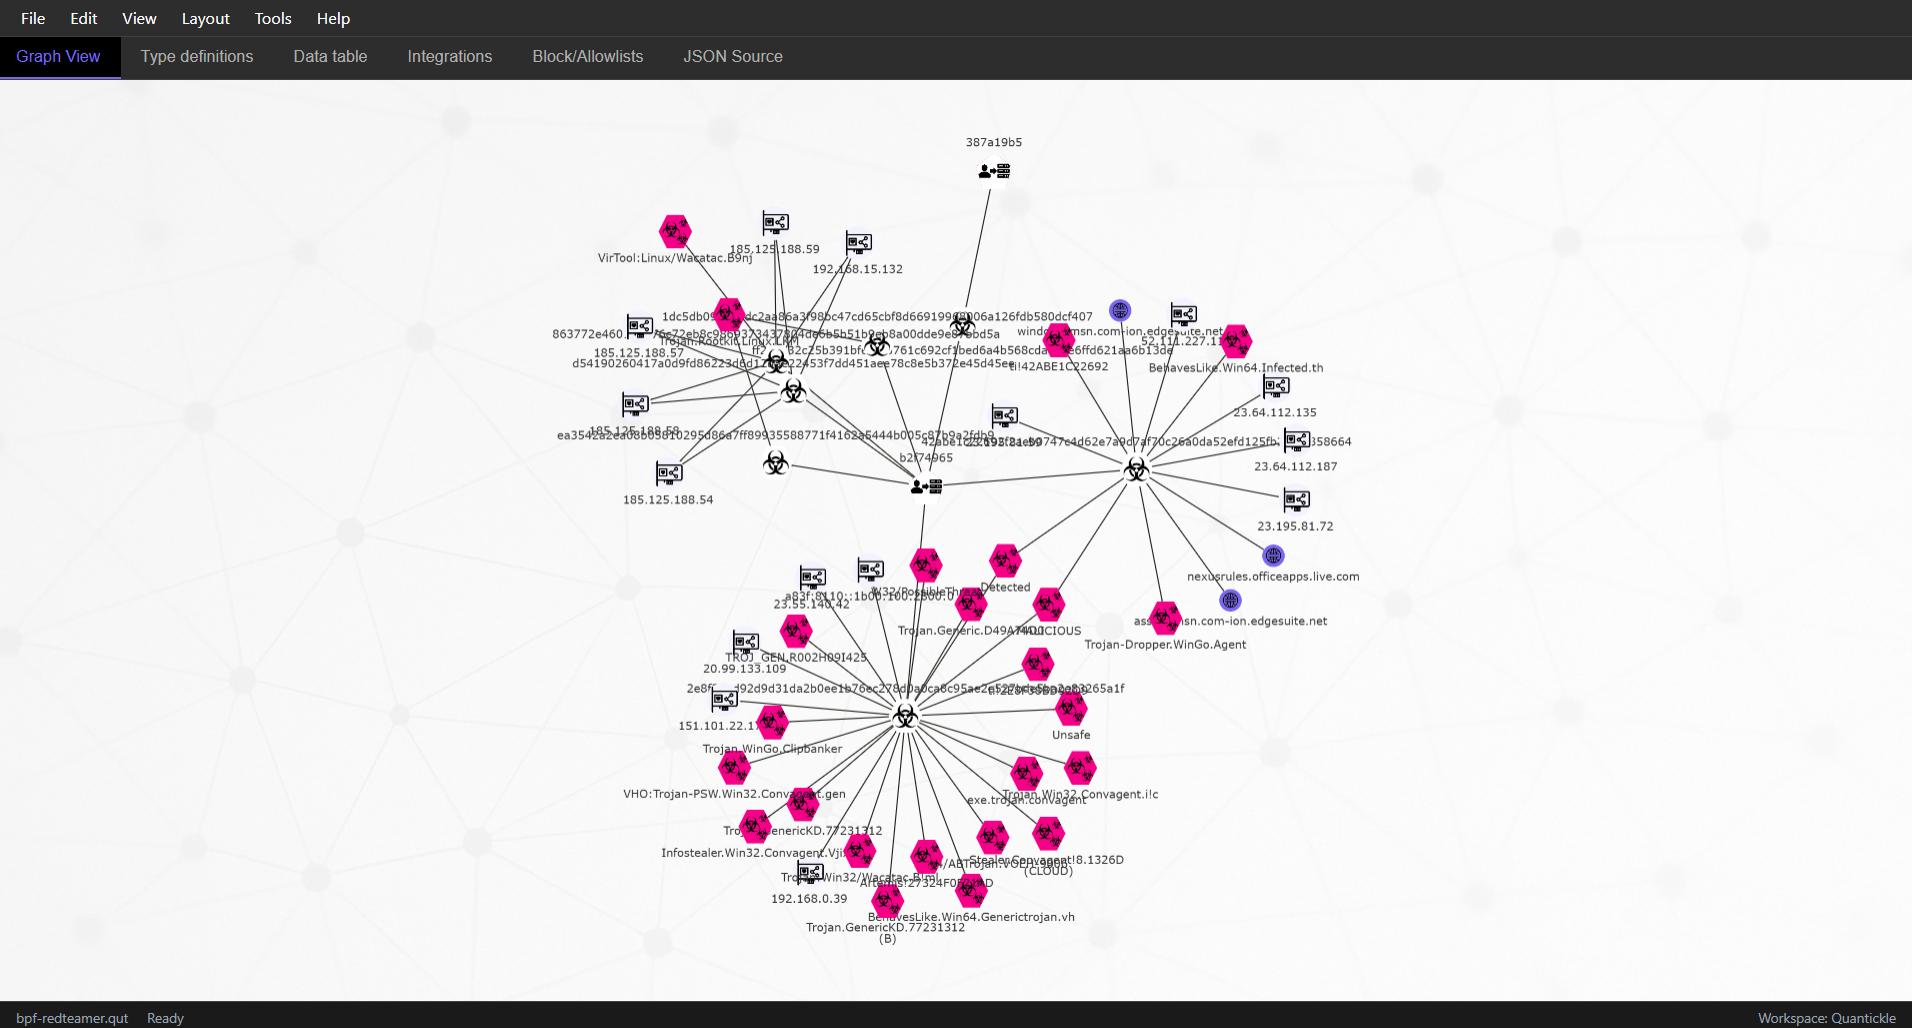
Choose between 20+ layouting algorithms (eg Klay vs Euler)


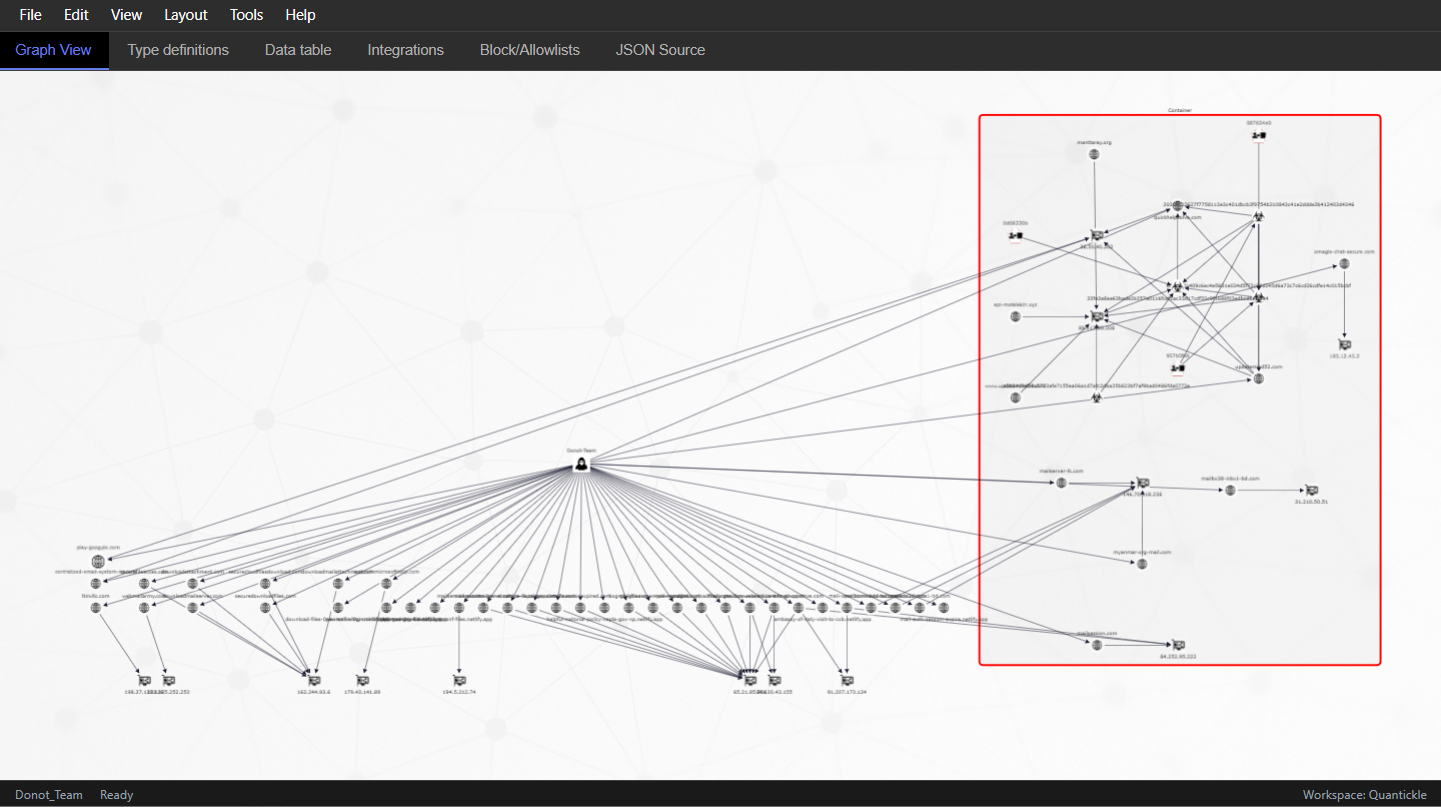
Enclose part of the graph in container nodes, and apply separate styling and layout


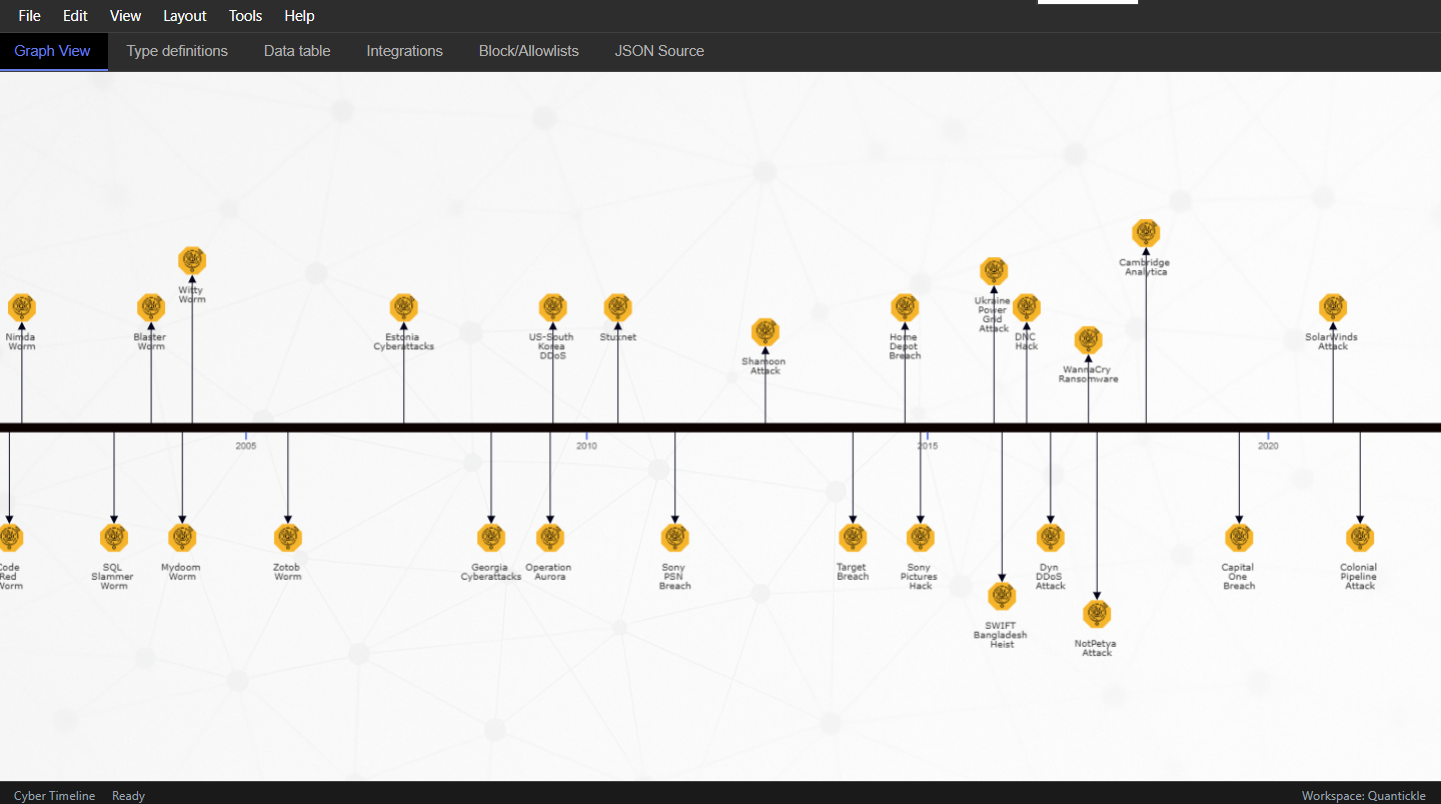
Timestamp your nodes to create timelines or time-colored graphs

Download Tool

Link graphs to create navigatable dashboards and logical connections
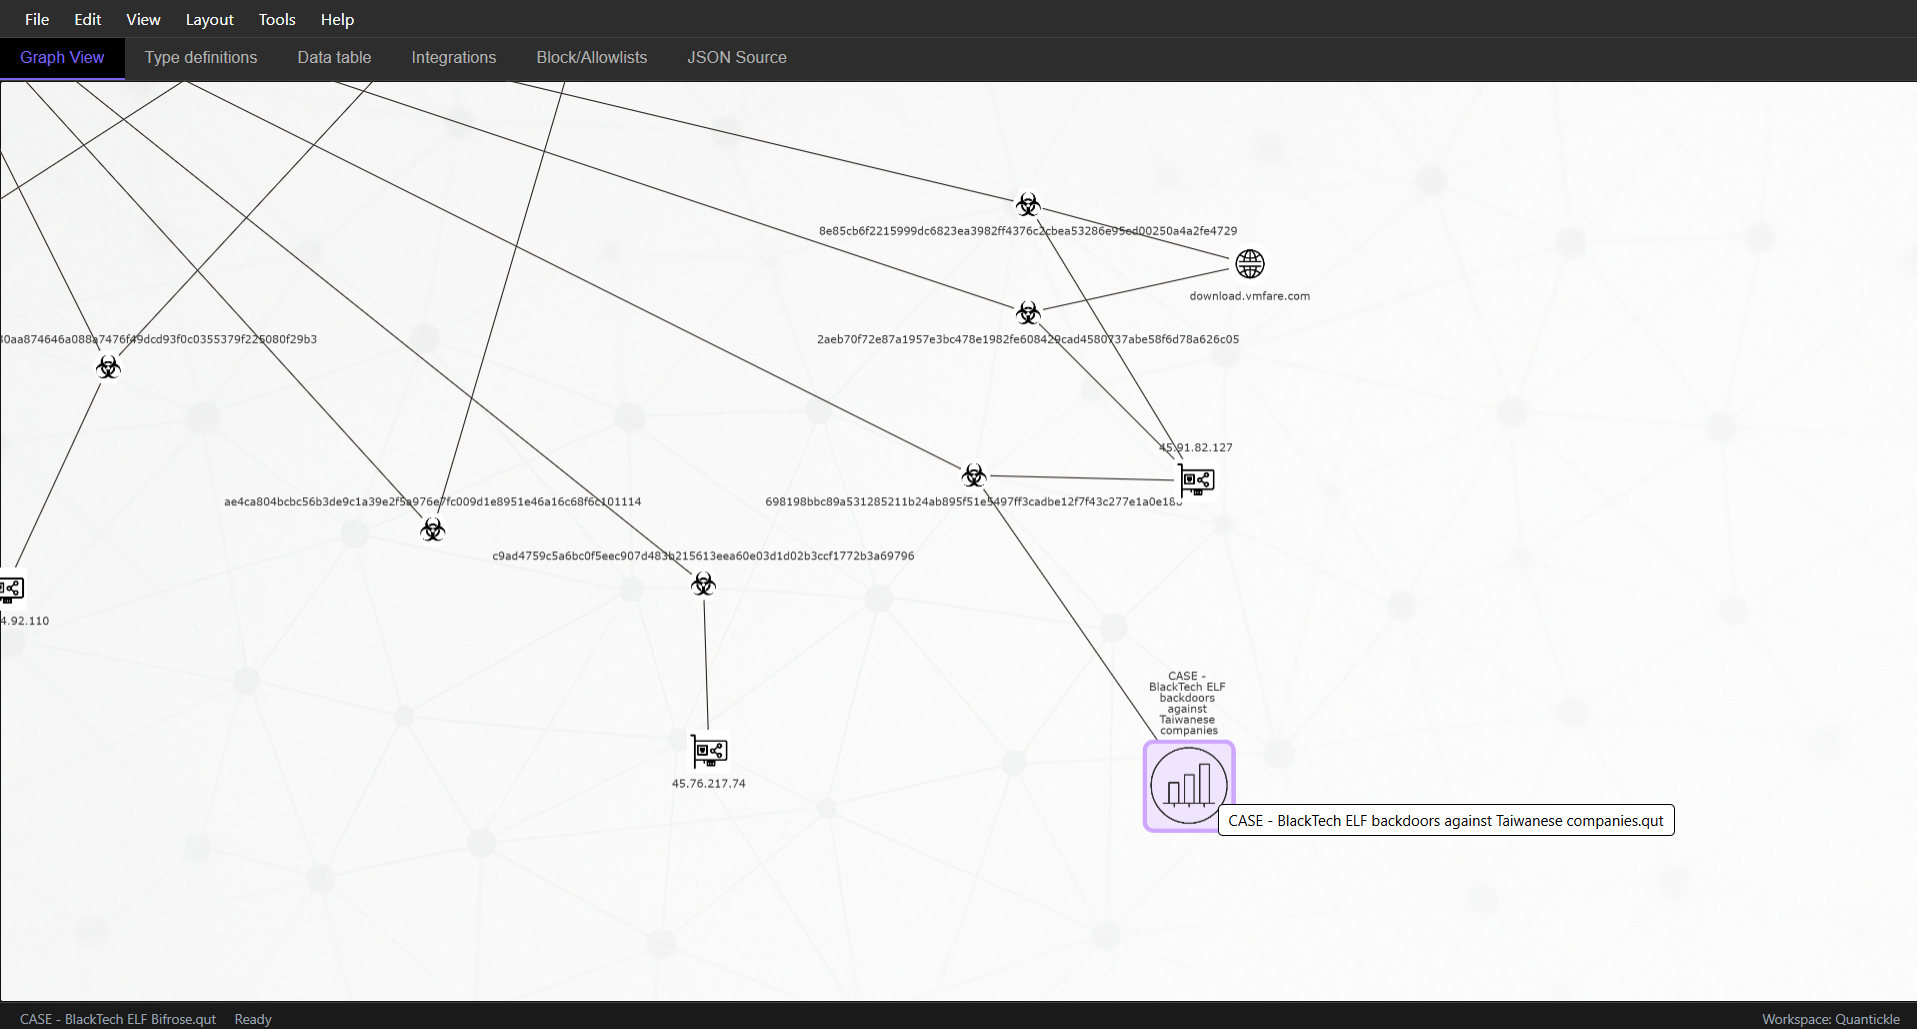

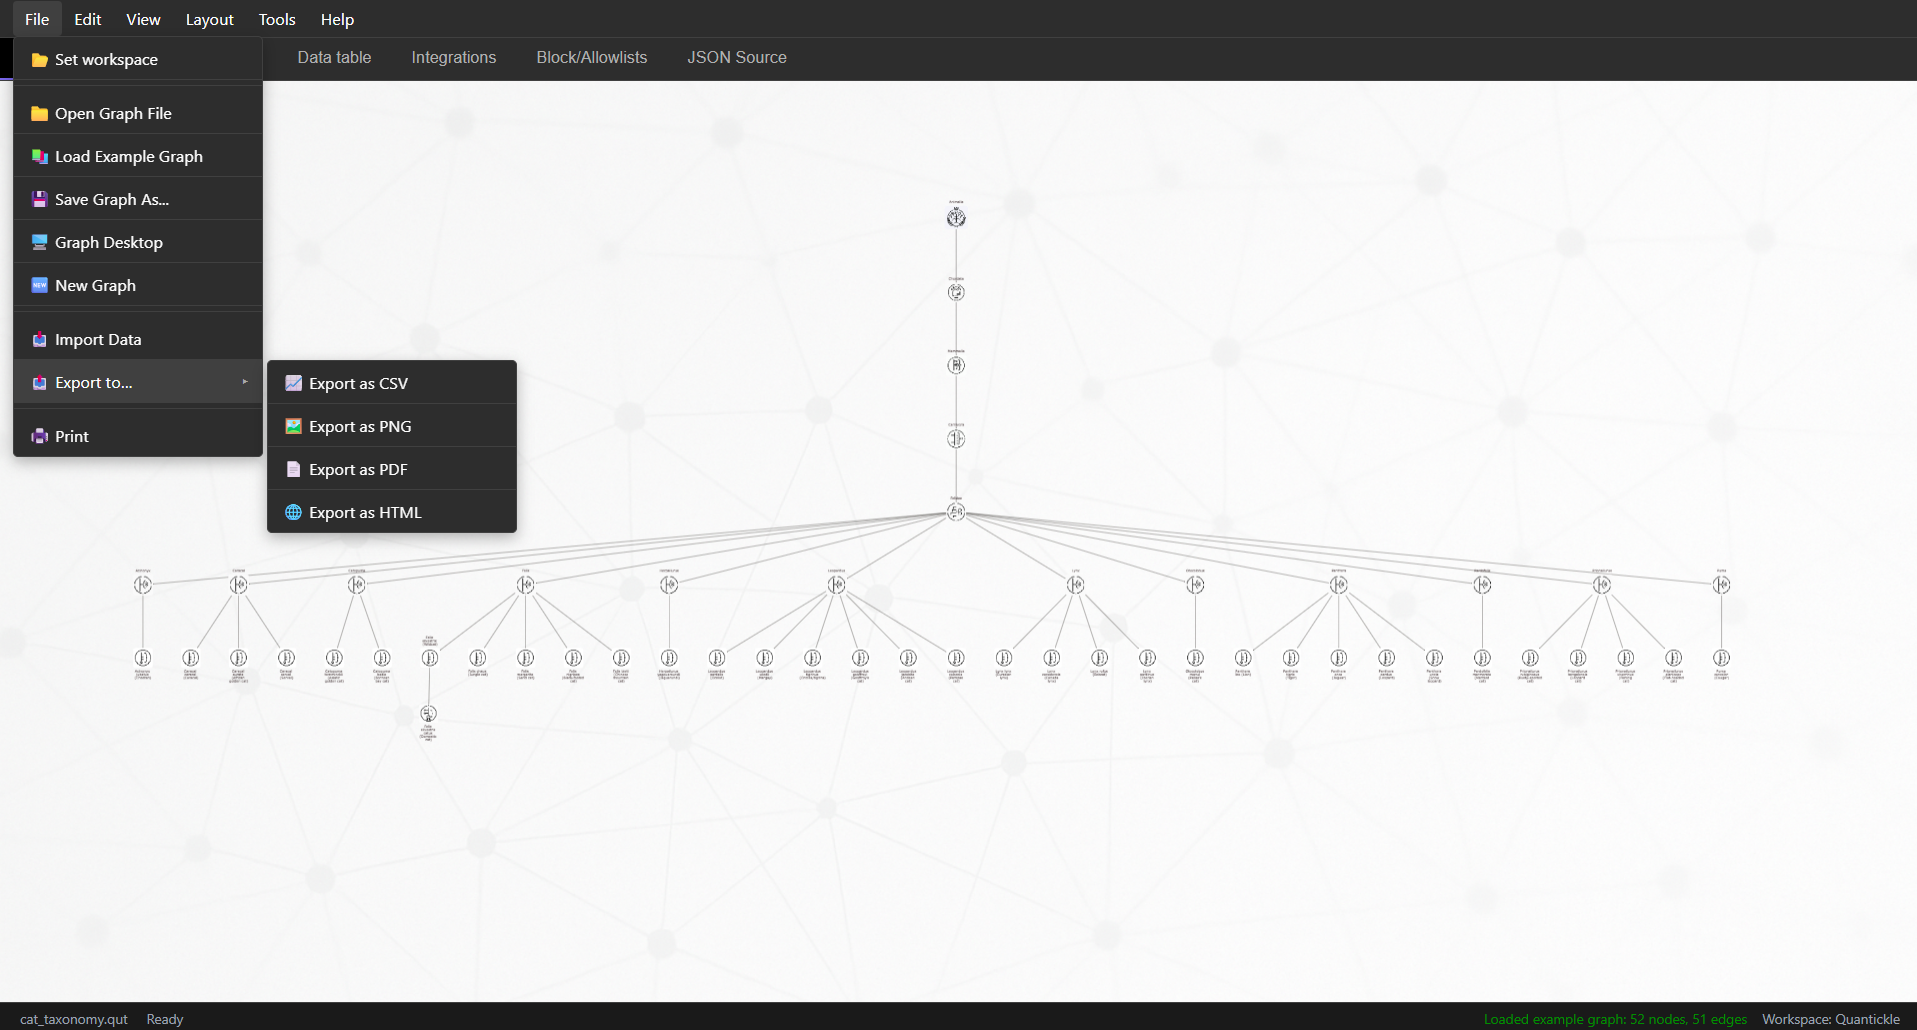
Save to JSON. Export to CSV, PDF, PNG, or static HTML. Import CSV, paste, or fetch content from integrations
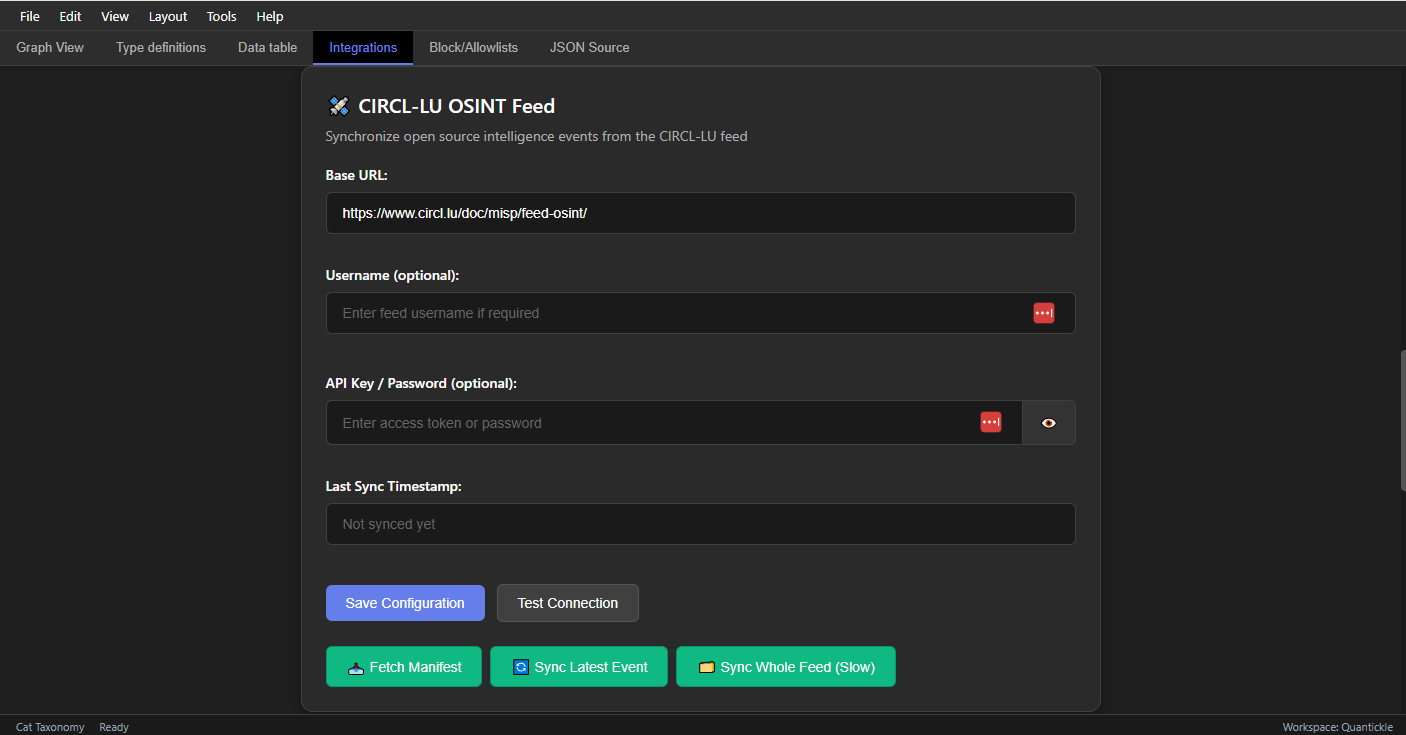
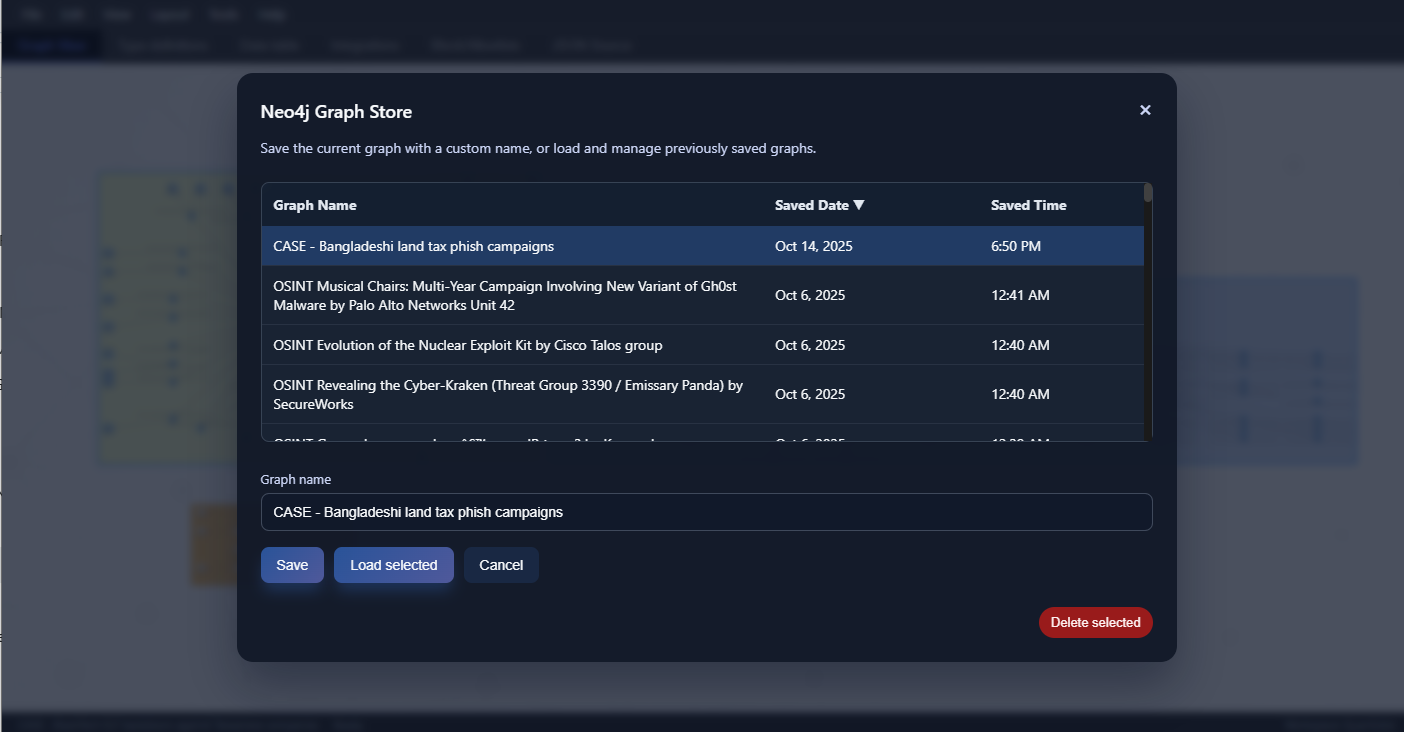
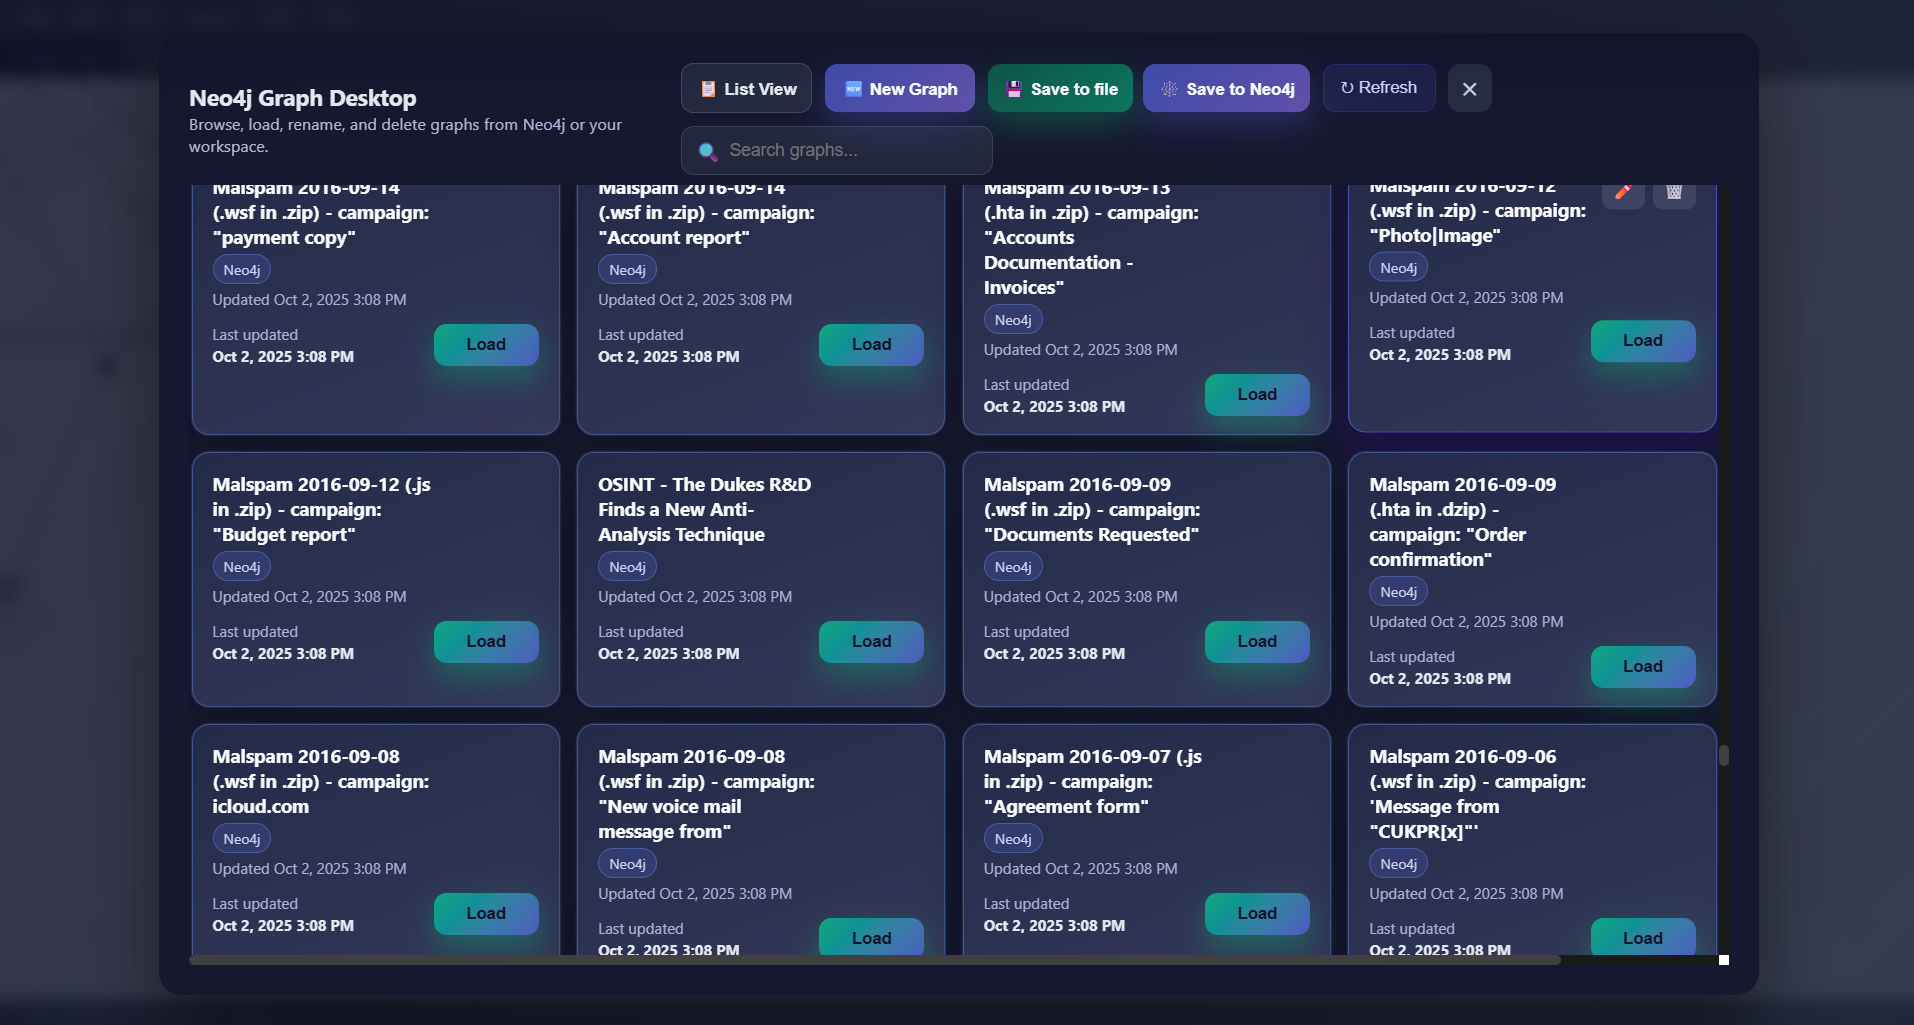
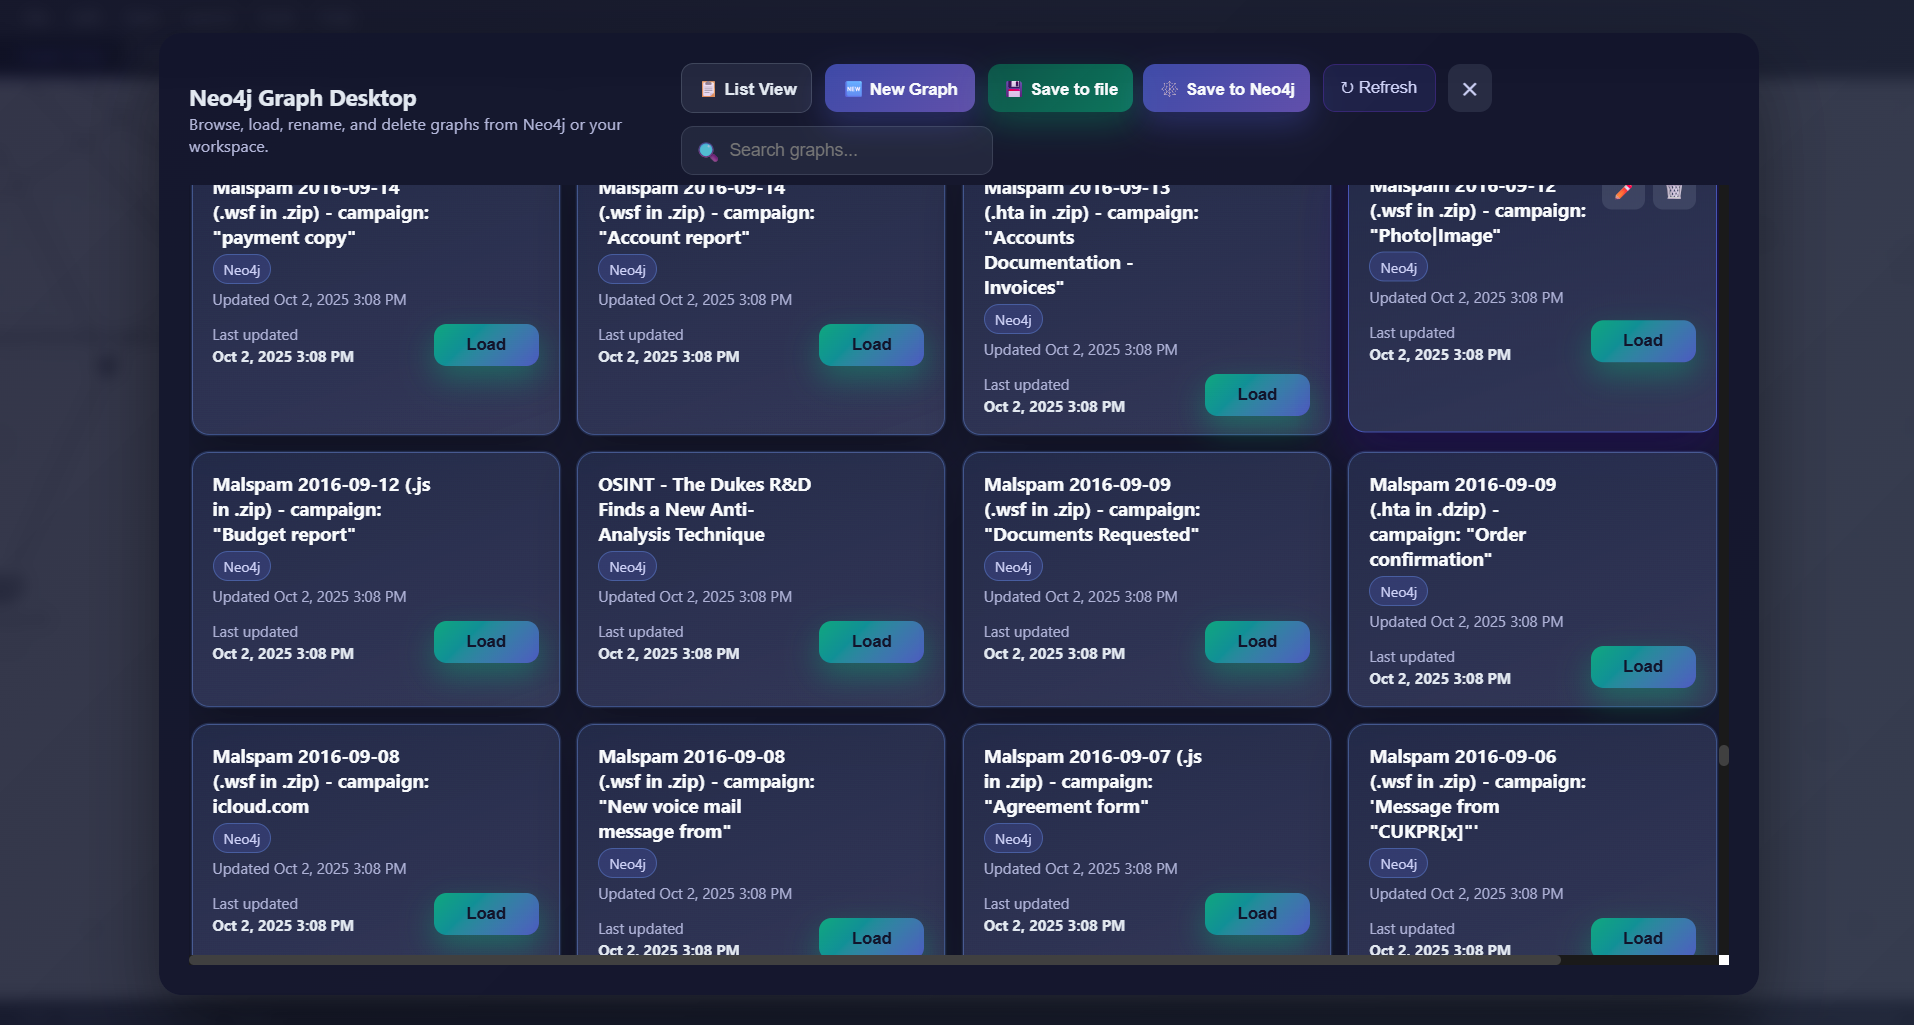
Optionally save to Neo4j databases
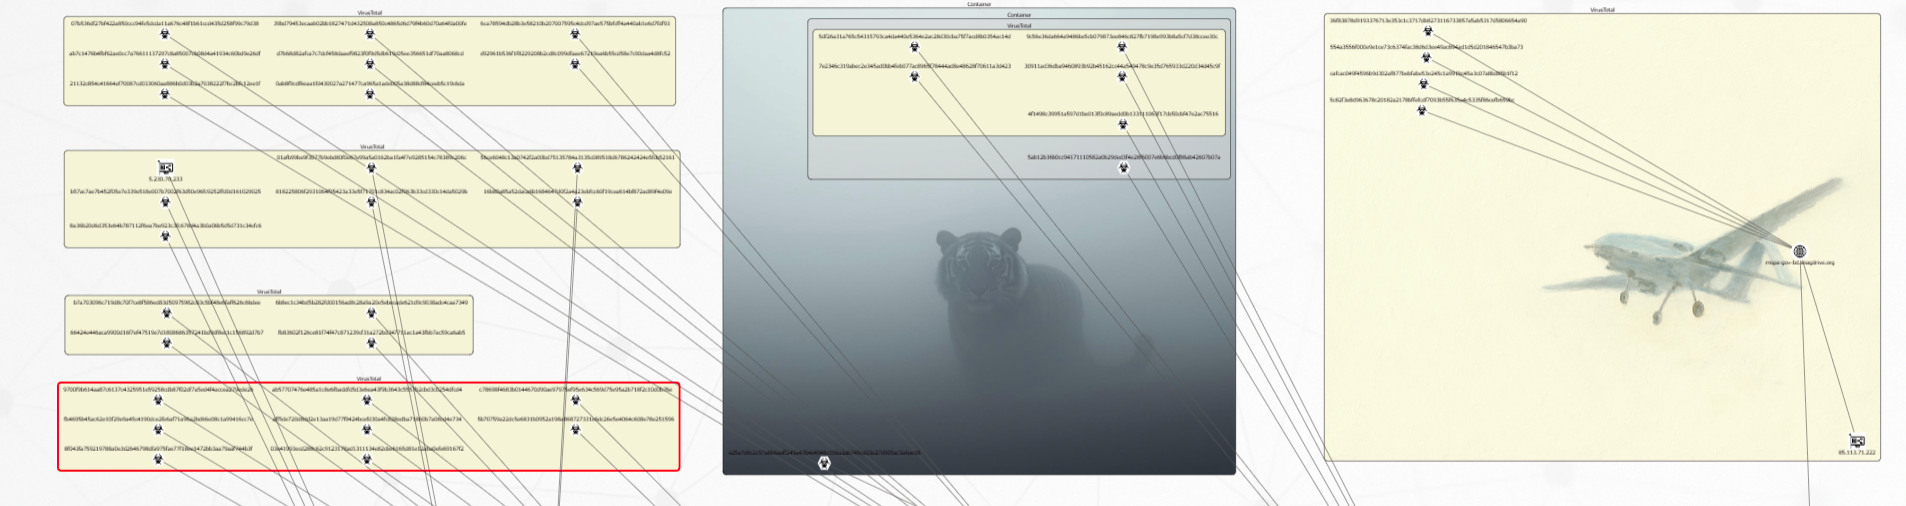
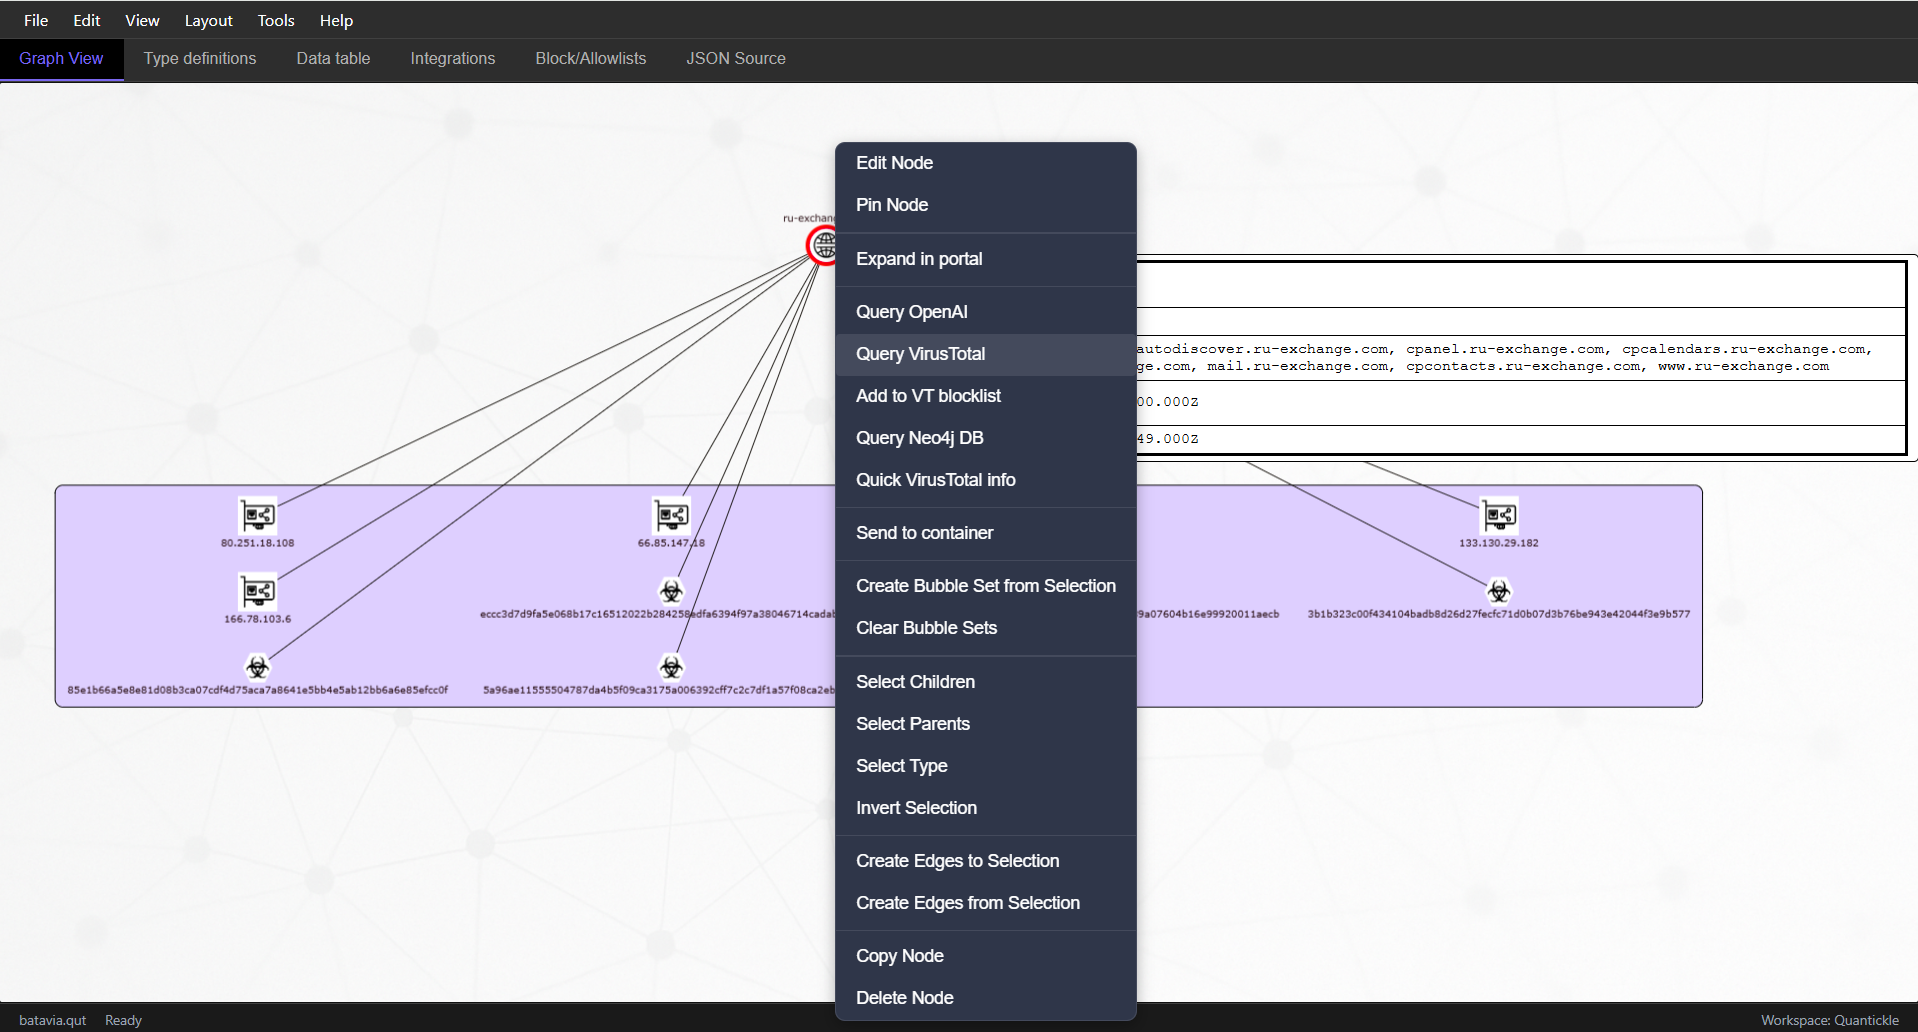
Query integrations like VirusTotal or OpenAI - get results back in separate containers
Core Concepts

Quantickle builds on a small set of shared concepts that connect the documentation set:

  • Coordinate system & spatial layouts — Quantickle’s absolute and depth-aware layouts use a 0–1000 cube for x, y, and z coordinates. See COORDINATE_SYSTEM.md for full spatial rules and lighting behavior.

  • Graph file management & project files — .qut files are the canonical saved state; they store nodes, edges, metadata, and container hierarchy.

  • Neo4j integration — the server can persist and retrieve graphs from Neo4j, including metadata snapshots. See NEO4J_INTEGRATION_README.md for configuration and workflow details.

Data Model

A Quantickle graph is a set of nodes and edges with metadata that drives layout, styling, and grouping.

  • Graph: The full dataset, including metadata, node array, edge array, and optional layout or view state.
  • Node: A vertex with required id plus optional attributes like , , , , and coordinates. Nodes may also include Markdown or custom properties used by integrations.
label
type
size
color
info
  • Edge: A relationship with source + target node IDs and optional label, type, weight, and styling metadata.
  • Container: A node that groups related elements. Containers can be nested and often serve as visual or semantic boundaries.
  • Quantickle’s internal graph JSON is a flattened structure with nodes and edges arrays. Container relationships and classes are preserved as node metadata.

    Import & Export Formats

    Quantickle accepts several import formats from File → Import Data and from automated integrations. Each importer feeds the same graph pipeline used when saving .qut project files, so the structures below also represent export shapes.

    CSV imports

    The CSV importer recognises two layouts:

    1. Node + edge sections – export format used by Quantickle and the safest option when preparing data manually. The file contains a node table followed by a blank row and an edge table:

      root@kitploit:~
      node_id,node_label,node_type,node_size,node_color,node_x,node_y
      srv-1,Gateway,server,40,#2dd4bf,100,250
      cli-1,Analyst,client,28,#38bdf8,320,210
      
      source,target,label,weight,type
      srv-1,cli-1,allows,1,connection
      

      Additional columns are tolerated—the importer normalises headers such as Node Label, nodeLabel, or label, preserves any explicit color/size values, and keeps coordinates when provided.

    2. Edge list with optional attributes – minimal CSVs that contain at least source and target columns. Optional columns such as label, type, weight, source_type, target_type, source_label, or color are merged into the generated nodes and edges when present:

      root@kitploit:~
      source,target,label,source_type,target_type
      srv-1,cli-1,allows,server,client
      srv-1,sensor-2,monitors,server,sensor
      

    Quantickle parses headers case-insensitively, accepts both snake_case and spaced names, and skips empty rows automatically.

    Edge list (.edges)

    Plain whitespace-separated edge pairs are supported for quick skeleton graphs. Missing nodes are created automatically:

    root@kitploit:~
    srv-1 cli-1
    srv-1 sensor-2
    

    Note: Excel workbooks (.xlsx) are no longer supported. Export or save the data as CSV before importing it into Quantickle.

    JSON

    File → Import Data also accepts JSON exports produced by Quantickle or raw Cytoscape element collections. When the file contains elements with nested data entries, they are normalised into Quantickle’s internal structure.

    Quantickle graph (.qut)

    .qut files are JSON documents with flattened node and edge objects. A minimal graph looks like:

    root@kitploit:~
    {
      "metadata": { "name": "My graph" },
      "nodes": [
        { "id": "srv-1", "label": "Gateway", "type": "server", "size": 40 }
      ],
      "edges": [
        { "id": "srv-1_cli-1", "source": "srv-1", "target": "cli-1", "label": "allows" }
      ]
    }
    

    Legacy files that store nodes/edges inside a data object are still accepted—the loader flattens them automatically and preserves coordinates, classes, and container hierarchy metadata.

    API payloads

    When exchanging data with the HTTP API or Neo4j integration, send the same flattened shape used by .qut files:

    root@kitploit:~
    {
      "nodes": [
        { "id": "srv-1", "label": "Gateway", "type": "server", "size": 40 }
      ],
      "edges": [
        { "id": "srv-1_cli-1", "source": "srv-1", "target": "cli-1", "label": "allows" }
      ]
    }
    

    The optional info field still supports Markdown and is persisted alongside any custom properties.

    Layouts

    Quantickle groups layouts into practical families so you can pick the right one for the task:

    • Force-directed (force, cose, fcose) — good for exploratory structure discovery and when you want natural clustering.
    • Hierarchical & flow (breadthfirst, dagre) — best for dependency trees, call graphs, or causal flows.
    • Grid & circle — fast, deterministic layouts for dashboards, small graphs, and exports.
    • Time-based (timeline, timeline-scatter, temporal-attraction) — use when temporal ordering or recency is the story.
    • Spatial/absolute (absolute, depth-aware) — use for map-like or diagrammatic layouts with known coordinates.
    • Cluster/radial (radial-recency) — use when you want grouping by type or recency rings.

    Layout Options

    root@kitploit:~
    // js/layouts.js
    const layoutOptions = {
      'force': {
        name: 'force',
        animate: true,
        randomize: false,
        infinite: false
      },
      'grid': {
        name: 'grid',
        rows: undefined,
        cols: undefined
      }
      // ... more layouts
    }
    

    Timeline Layout

    The custom timeline layout positions nodes along a time axis. You can customize the central bar via the barStyle option:

    root@kitploit:~
    cy.layout({
      name: 'timeline',
      barStyle: {
        color: '#3498db',    // bar color
        height: 15,          // bar height in pixels
        className: 'my-timeline-bar' // optional CSS class
      }
    }).run();
    

    When className is provided, the timeline bar receives that class and its default color and height styling are removed so you can target it via CSS.

    Radial Recency Layout

    Use radial-recency to plot newest items closest to the center and older ones on outer rings. The layout maps angle to a secondary attribute (type/cluster/group) so related nodes stay aligned around the circle. You can tune the rings with a few options:

    root@kitploit:~
    cy.layout({
      name: 'radial-recency',
      ringThickness: 140, // radial spacing between time rings
      minSeparation: 80,  // minimum distance between neighbors along a ring
      angleJitter: 0.15,  // optional jitter (radians) to break perfect symmetry
      angleStrategy: 'grouped' // or 'alphabetical' for deterministic ordering
    }).run();
    

    See graphs/radial_time_rings.qut for a small fixture that demonstrates concentric time bands grouped by cluster/type metadata.

    Timeline Scatter Layout

    Use the timeline-scatter layout to map timestamps directly to x positions while distributing nodes vertically by similarity, category, or community. It accepts tunable scales for both axes and optional jitter to reduce overlap:

    root@kitploit:~
    cy.layout({
      name: 'timeline-scatter',
      xScale: 0.5,   // pixels per millisecond (auto-calculated when omitted)
      yScale: 60,    // spread for similarity/category lanes
      jitter: 4,     // optional per-node jitter to minimise overlap
      barStyle: {    // applied when timeline bars already exist
        color: '#222',
        height: 12,
        className: 'scatter-bar'
      }
    }).run();
    

    Nodes with numeric similarity scores (similarity, similarityScore, or similarity_score) are centred around the mean, while categorical or community labels create evenly spaced lanes along the y-axis.

    Temporal Attraction Layout

    Use timestamp distance to steer spring strengths while keeping repulsion light:

    root@kitploit:~
    cy.layout({
      name: 'temporal-attraction',
      timeMode: 'gaussian',          // or 'bucket'
      timeSigma: 60 * 60 * 1000,     // Gaussian falloff window (in ms)
      bucketSize: 24 * 60 * 60 * 1000, // bucket size when using bucket mode
      repulsionStrength: 12          // minimal node repulsion
    }).run();
    

    Select Layout → Temporal Attraction - Time Weighted in the UI or pass name: 'temporal-attraction' through the CLI/API layout configuration to enable it.

    Integrations

    Quantickle can pull data from or sync with external systems. Integrations generally flow through the server because they require credentials, proxy rules, or persistence.

    • Neo4j — store and query graph snapshots; see NEO4J_INTEGRATION_README.md.
    • SerpAPI — used by the RAG pipeline for web search; see API keys.
    • VirusTotal — enrich nodes with domain/IP/file/URL intelligence and relationship graphs.
    • CIRCL-LU (MISP OSINT feed) — ingest curated MISP events from the CIRCL-LU feed.
    • OPML RSS watcher — import OPML feed lists and turn matching articles into graphs.

    Workflows

    🧭 First steps in the app

    • Launch the UI in your browser at http://localhost:3000.
    • Use File → Set workspace to choose where project files live.
    • Import datasets via File → Import Data, paste data from clipboard, or simply place nodes manually using the context menu.
    • Switch between Graph, Type Definitions, and Data table views as needed.
    • Open the Node Editor through Tools → Node Editor for detailed editing.
    • For setting graph default values, use the Tools → Graph Area Editor.

    For deeper walkthroughs and screenshots, see the Usage Guide.

    Exporting & sharing

    • Save to .qut for a full-fidelity project snapshot (layout, metadata, containers).
    • Export CSV for interoperability with spreadsheet tools or graph pipelines.
    • Export static HTML, PNG or PDF for report-ready outputs.

    Initialization

    Quantickle initializes through the global window.QuantickleApp defined in js/main.js. The application automatically calls window.QuantickleApp.init() when the DOM is ready.

    Configuration

    Performance Settings

    root@kitploit:~
    // js/config.js
    const config = {
      performance: {
        nodeLimit: 1000,           // Max nodes to render at once
        batchSize: 100,           // Nodes to add per batch
        webgl: true,              // Enable WebGL rendering
        hideEdgesOnViewport: false // Hide edges while dragging
      }
    }
    

    API

    HTTP API

    The Express server (server.js) serves the static front-end and exposes several JSON endpoints used by the UI. All routes are prefixed with /api:

    Method & PathDescription
    GET /api/domain-filesLists JSON domain definitions present in assets/domains/.
    GET /api/examplesReturns metadata about bundled example .qut graphs.
    GET /api/serpapiProxies Google Search requests to SerpApi; requires SERPAPI_API_KEY in the query string or environment.
    GET /api/openai/modelsProxies OpenAI model listing requests to api.openai.com; requires an Authorization: Bearer ... header.
    GET /api/proxy?url=…Forwards HTTP/HTTPS requests to allowed hosts with browser-like headers.
    POST /api/neo4j/graphPersists a graph to Neo4j. Accepts the flattened Quantickle graph JSON body described above.
    POST /api/neo4j/node-graphsFinds saved graphs that contain nodes matching the provided labels array.
    GET /api/neo4j/graphsLists graphs stored in Neo4j along with summary metadata.
    GET /api/neo4j/graph/:nameFetches a saved graph, returning metadata, nodes, and edges.
    DELETE /api/neo4j/graph/:nameRemoves a stored graph from Neo4j.

    All Neo4j endpoints accept credentials via the X-Neo4j-Url, X-Neo4j-Username, and X-Neo4j-Password headers (or the NEO4J_URL, NEO4J_USER, and NEO4J_PASSWORD environment variables on the server). When provided, the metadata object is saved alongside the graph and a savedAt timestamp is automatically appended.

    API Keys

    Some features require API keys. These are stored in the browser's local storage via the Integrations panel.

    • SerpAPI — required for the RAG pipeline's web search. Add your key in the Integrations dialog and it will be used by the client-side RAG pipeline.
    • VirusTotal — used to enrich domain/IP/file/URL nodes and pull relationship graphs.
    • CIRCL-LU — optional authentication credentials if your MISP feed requires them.

    For command-line usage, you may alternatively set SERPAPI_API_KEY in the environment.

    Backend Proxy

    The server exposes a CORS-bypassing proxy that forwards HTTP(S) requests to hosts listed in the proxy allowlist. Use /api/proxy with a URL parameter:

    root@kitploit:~
    curl "http://localhost:3000/api/proxy?url=https%3A%2F%2Fopentip.kaspersky.com%2F"
    

    The base allowlist lives in config/proxy-allowlist.json. You must provide this file (or set a comma-separated PROXY_ALLOWLIST environment variable before starting the server); otherwise the proxy logs a fatal configuration error and rejects every request with HTTP 403.

    Integration-specific hosts (for backend integration adapters like OpenAI and VirusTotal) are governed by config/integration-allowlist.json (or INTEGRATION_ALLOWLIST). At runtime, both allowlists are merged. Each entry should list a host or wildcard pattern that the proxy may reach. Wildcards using * are supported anywhere in an entry, so *.example.com permits any subdomain of example.com, and masks like news-* behave as expected. Subdomains also inherit their parent domain's entry, so adding example.com automatically permits www.example.com.

    A minimal allowlist file looks like:

    root@kitploit:~
    {
      "allowlist": ["otx.alienvault.com", "feeds.example.org"]
    }
    

    If you prefer environment variables, set PROXY_ALLOWLIST="otx.alienvault.com,feeds.example.org" before launching the server.

    When the proxy forwards a request it now sends a browser-like header set (including modern Chrome User-Agent, Accept, Accept-Language, and Sec-Fetch-* values) so sites that gate content behind anti-bot filters respond the same way they would to a normal page load. Any of these headers can be overridden by providing x-proxy-<header> overrides from the client request when needed.

    Storage

    Quantickle keeps graph state in the browser while you work, then persists it when you export or sync.

    • Browser storage — settings and API keys are stored locally in the browser.
    • Project files (.qut) — saved to your workspace folder for full-fidelity graph snapshots. See GRAPH_FILE_MANAGEMENT_README.md for workspace rules and file lifecycle.
    • Neo4j — optional server-side persistence for collaboration and search, configured via the Neo4j integration.

    Project Structure

    root@kitploit:~
    quantickle/
    ├── assets/                               # Static assets
    │   ├── backgrounds/                      # Background graphics
    │   ├── icons/                            # Mostly empty now; icons are colocated with node types
    │   ├── domains/                          # Node type definitions
    │   ├── help/                             # Help pages
    │   ├── examples/                         # Example graphs
    │   └── css/                              # Stylesheets referenced by index.html
    ├── config/                               # Proxy allowlist
    ├── data_retrieval/                       # SerpAPI/web search helpers used by the RAG pipeline
    ├── graphs/                               # Workspace folder for bundled and test .qut graphs
    ├── js/                                   # Front-end source modules
    │   ├── main.js                           # Application bootstrap
    │   ├── ai-input-manager.js               # Currently unused
    │   ├── api.js                            # HTTP client for server endpoints
    │   ├── graph.js                          # Graph rendering and management
    │   ├── graph-manager.js                  # High-level graph state orchestration
    │   ├── graph-reference-resolver.js       # Normalization of graph references
    │   ├── layouts.js                        # Layout registration and options
    │   ├── 3d-globe-layout.js                # 3D Layout
    │   ├── absolute-layout.js                # Absolute coordinate layout
    │   ├── custom-layouts.js                 # Other custom layouts
    │   ├── aggressive-performance-fix.js     # Aggressive Performance Fix for Large Graph Panning 
    │   ├── non-invasive-performance-fix.js   # Non-Invasive Performance Fix for Large Graphs
    │   ├── lod-system.js                     # Level of Detail (LOD) System
    │   ├── auto-refresh.js                   # Auto-refresh functionality when new data arrives
    │   ├── config.js                         # Default settings
    │   ├── domain-loader.js                  # Loading and managing domain-specific node type configurations
    │   ├── edge-editor.js                    # Editing edge styles
    │   ├── extensions.js                     # Loading and registration of Cytoscape extensions 
    │   ├── integrations.js                   # Configuration and connection to external services
    │   ├── rag-pipeline.js                   # Handles AI-assisted data ingestion
    │   ├── secure-storage.js                 # Encrypts sensitive values in sessionStorage
    │   ├── source-editor.js                  # Editor for the JSON graph source
    │   ├── tables.js                         # Data table updates, filtering, and display
    │   ├── ui.js                             # User interface interactions and notifications
    │   ├── validation.js                     # Validation of all data inputs
    │   ├── workspace-manager.js              # Workspace file functionality
    │   ├── utils.js                          # Shared browser utilities
    │   ├── integrations/                     # Integration-specific helpers (MISP/CIRCL-LU, etc.)
    │   └── features/                         # Feature modules (node editor, callouts, timeline, ...)
    ├── tests/                                # Automated regression tests covering UI flows, imports, and APIs
    ├── utils/                                # Node helpers (Neo4j client, readability shim, CLI scripts)
    ├── public/                   
    │   ├── index.html                        # Static front-end
    │   └── favicon.ico                       # Main app icon
    ├── package.json                          # Node dependencies and scripts
    └── server.js                             # Express server exposing the HTTP API
    

    🐛 Troubleshooting

    Common Issues

    1. Graph Not Rendering

      • Check browser console for errors
      • Verify data format
      • Check WebGL support
    2. Poor Performance

      • Reduce node limit in config
      • Enable WebGL rendering
      • Use simpler layouts for large graphs
    3. Layout Issues

      • Try different layout algorithms
      • Adjust layout parameters
      • Check for disconnected nodes

    🤝 Contributing

    This project is not actively maintained as a canonical store. PR's will likely be ignored. However, feedback, bug reports and comments are welcome.

    📄 License

    This project is licensed under the Apache 2.0 License - see the LICENSE file for details.

    🙏 Acknowledgments

    • Built with Cytoscape.js
    • Layout algorithms from various Cytoscape contributors
    • Performance optimizations inspired by large-scale graph visualization research

    📚 Additional Documentation

    • Usage Guide
    • Graph File Management
    • Neo4j Integration
    • Coordinate System
    • Performance Guide