 rnb-team/loghound
Post-Exploitation EVTX Analyzer for BloodHound Mapping

Post-Exploitation EVTX Analyzer for BloodHound Mapping
LogHound collects and parses Windows Security Event Logs (.evtx) to extract authentication events, session data, and logon metadata for ingestion into BloodHound and for deeper adversarial telemetry.
LogHound was built to solve a specific problem for Red Teams and network penetration testers: how to efficiently track lateral movement targets, decipher active user sessions, and establish definitive machine ownership without burning operational security (OpSec).
Event log files (Security.evtx) on Active Directory Domain Controllers can be multi-gigabyte beasts. Traditional loading techniques often exhaust system memory or crash, leaving loud artifacts. LogHound addresses this by utilizing a chunk-based streaming paradigm on top of the robust Impacket framework.
It maps network structures, establishes who actually "owns" a machine based on login frequency, calculates precise working hours to identify off-hours (Night Owl) operations, and feeds this intelligence seamlessly into BloodHound CE (v5+).
LogHound relies on Python 3 and Impacket. It is highly recommended to use a virtual environment.
# 1. Clone the repository
git clone https://github.com/LogHound/LogHound.git
cd LogHound

# 2. (Optional but Recommended) Create a Python virtual environment
python3 -m venv venv
source venv/bin/activate

# 3. Install the required dependencies
pip install -r requirements.txt
LogHound's CLI interacts identically to standard Impacket modules (like secretsdump.py), requiring you to specify an explicit operation mode (--local or --remote).
python loghound.py [[domain/]username[:password]@]<targetName or address> [options]
--local EVTX_FILE: Parse a .evtx file already residing on your local machine.--remote: Pull Security.evtx down from the remote target system using the supplied credentials.-hashes LMHASH:NTHASH: Use NTLM hashes for Pass-The-Hash authentication.-k: Use Kerberos authentication. Pulls credentials from a .ccache file specified by the KRB5CCNAME environment variable.-aesKey hex_key: Use a specific AES key (128 or 256 bits) for Kerberos.-no-pass: Do not prompt for a password interactively.-keytab KEYTAB_FILE: Use a Kerberos keytab file for authentication.-dc-ip IP: Explicit IP Address of the domain controller.-target-ip IP: Explicit IP Address of the target machine (bypasses NetBIOS name resolution failures).-format {json,csv,md,all}: Dictates the text-based output format. Note: An interactive HTML report and the BloodHound JSON files are always generated. Default is json.-outputfile BASENAME: Name prefix for the generated output reports in the subdirectories.-threads N: Number of parser threads to run in parallel (Default: 4).-chunk-size N: Number of log records per parsing chunk. Lower values reduce RAM overhead; higher values parse slightly faster (Default: 1000).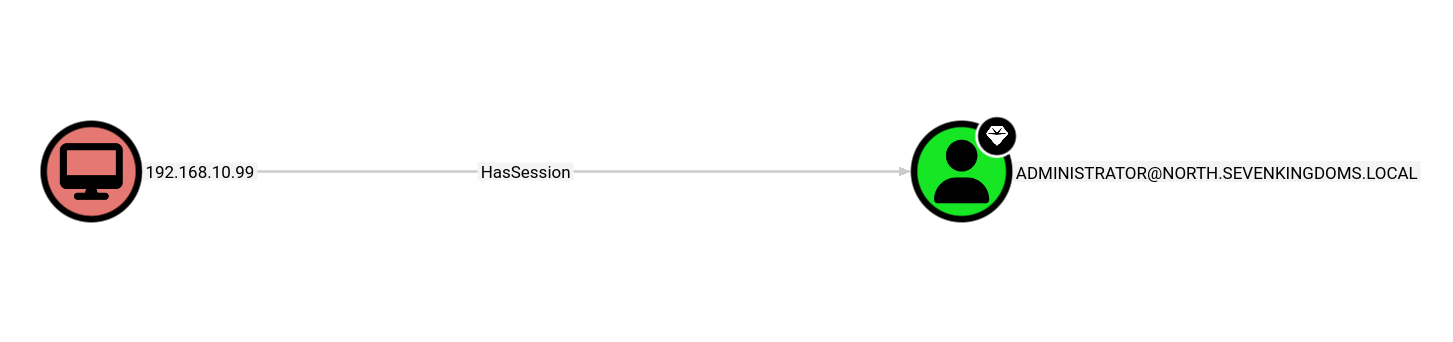
LogHound utilizes a highly decoupled, memory-efficient analytical pipeline:
core/collector.py): Connects to the target via SMB, then executes wevtutil epl Security via WMI to export the Security event log to a temp file on the target. The exported file is then downloaded via SMB into loot/YYYY-MM-DD_<target>_Security.evtx to avoid overwrites.core/parser.py): A threaded chunk parser streams over the raw .evtx binary and continuously emits parsed events into a temporary JSON Line buffer (jsonl/loghound_dump.jsonl). If interrupted, it can resume from precise checkpoints.core/analyzer.py): Iterates line-by-line over the .jsonl stream to keep a low RAM footprint. It computes intermediate state dictionaries (session tracking, ownership scoring, logic tracking).core/exporter.py & core/exporter_bloodhound.py): Flushes the analysis RAM-state into the final html/ and json/ export formats dynamically.For deep architectural logic and previously addressed ingestion errors, please refer to the inner documentation at ARCHITECTURE.md.
LogHound filters natively for six explicit Windows Security Event IDs: 4624, 4634, 4648, 4768, 4769, 4776.
Using these events, LogHound augments BloodHound CE by tying the following custom attributes directly to generated User nodes via the Properties block:
ObjectIdentifier mappings align perfectly with existing SharpHound ingests. AD Domain Users receive their native Windows SID (S-1-5-21-...). To prevent BloodHound node tearing, Local Machine Accounts accurately maintain the fallback USER@HOSTNAME standard.computers.json utilizes the exact native SessionAPIResult data structure to draw real "HasSession" edges between machines and users.The analysis engine calculates working operational hours based on tracked logon/logoff events, omitting anomalies (like sessions spanning multiple days).
| Property Name | Type | Metric Description |
|---|---|---|
loghound_avg_start_time | String | Calculates the average first logon (00:00 HH:MM) recorded across all observed valid days for the user. |
loghound_avg_end_time | String | Calculates the average last activity (logoff or last touch) recorded per day. |
loghound_active_days | Integer | Total count of validated days (with at least one proper session) utilized to compute the average time arrays. |
loghound_outside_hours | Boolean | True/False. Specifically identifies a Night Owl. Evaluates as True if the user's computed active start-to-end window overlaps the overnight range of 22:00 to 06:00. |
Avg Hours per Day | Float | Internally calculated as the exact time difference between the user's average start time and average end time. (Displayed in text/HTML reports). |
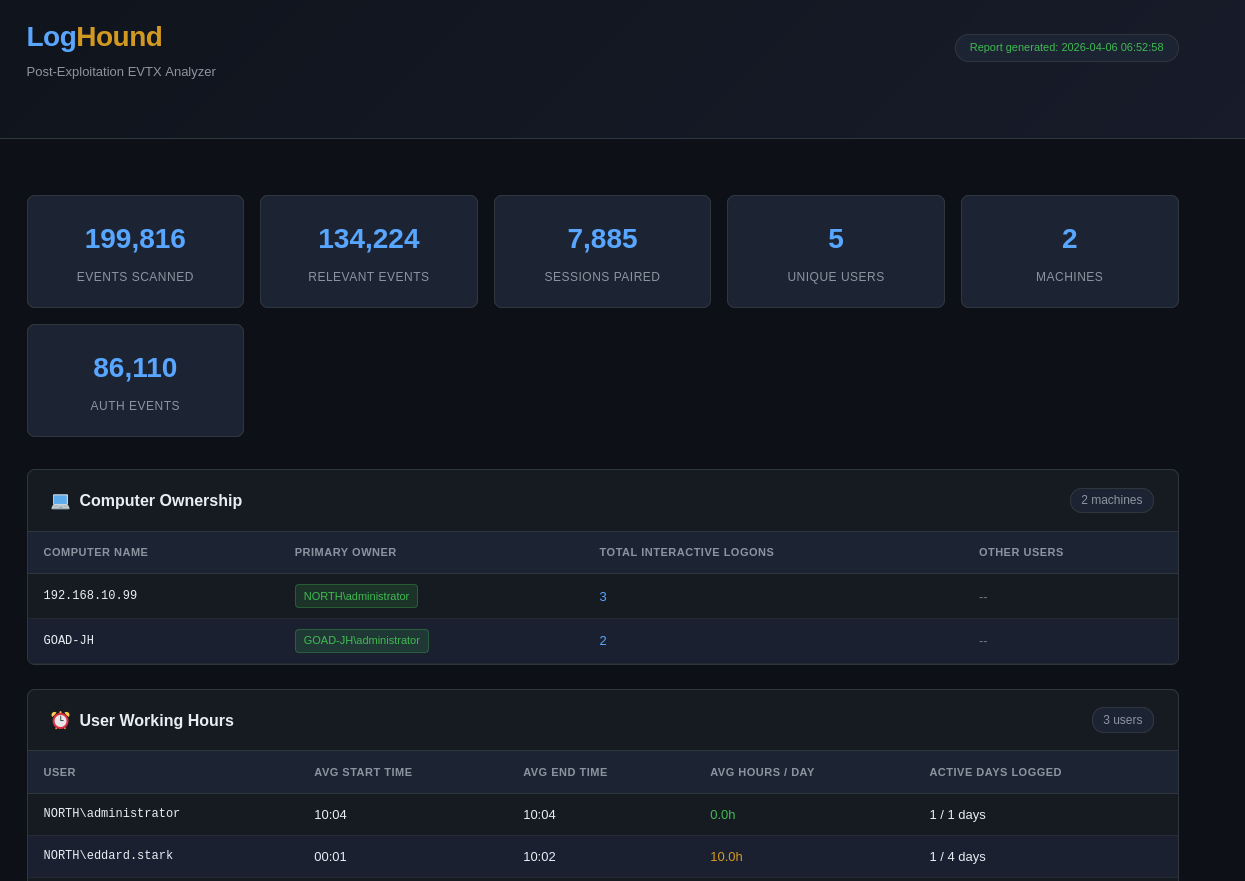
The analysis determines the explicit owner of any Workstation or IP Address by counting the most frequent interactive Logons. This binds a primary Owner to the origin node along with an array of secondary Other Users.
This software is provided for educational, authorized penetration testing, and forensic investigation purposes only. Do not use this against networks for which you do not have explicit permission to operate within.
This project is licensed under the Apache License 2.0 - see LICENSE file.
