 reorx/httpstat
CLI tool that wraps curl to visualize HTTP request timing breakdowns (DNS, TCP, TLS, server processing) with structured JSON output and SLO threshold checking for network performance diagnostics.

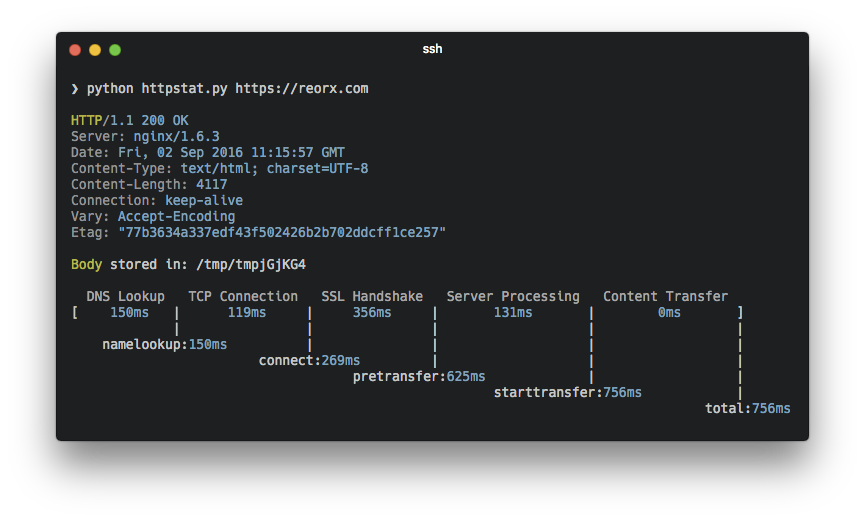
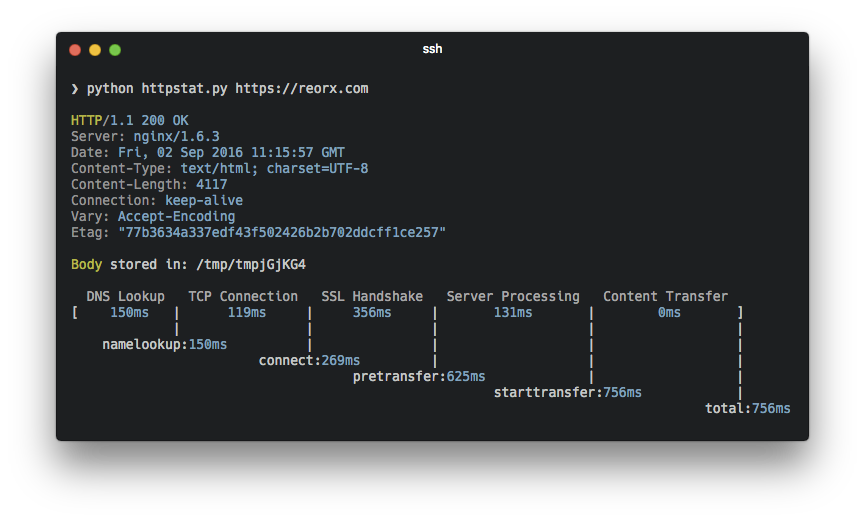
httpstat visualizes curl(1) statistics in a way of beauty and clarity.
It is a single file🌟 Python script that has no dependency👏 and is compatible with Python 3🍻.
--format json / jsonl for machine consumption with a stable v1 schema--slo total=500,connect=100 exits with code 4 on violation--save path.json for multi-step workflowsThere are three ways to get httpstat:
Download the script directly: wget https://raw.githubusercontent.com/reorx/httpstat/master/httpstat.py
Through pip: pip install httpstat
Through homebrew (macOS only): brew install httpstat
For Windows users, @davecheney's Go version is suggested. → download link
httpstat ships with an agent skill that teaches AI coding assistants (Claude Code, Cursor, etc.) how to use httpstat for HTTP performance diagnostics — automatic installation, bottleneck identification, and actionable fix suggestions.
Install the skill into your project:
npx skills add reorx/httpstat
Once installed, your agent will automatically use httpstat when you ask questions like "why is this API slow?" or "debug this endpoint's latency".
Simply:
python httpstat.py httpbin.org/get
If installed through pip or brew, you can use httpstat as a command:
httpstat httpbin.org/get
Because httpstat is a wrapper of cURL, you can pass any cURL supported option after the url (except for -w, -D, -o, -s, -S which are already used by httpstat):
httpstat httpbin.org/post -X POST --data-urlencode "a=b" -v
Use --format (-f) to get machine-readable output:
httpstat httpbin.org/get --format json
{
  "schema_version": 1,
  "url": "httpbin.org/get",
  "ok": true,
  "exit_code": 0,
  "response": {
    "status_line": "HTTP/2 200",
    "status_code": 200,
    "remote_ip": "...",
    "remote_port": "443",
    "headers": {"Content-Type": "application/json", "Server": "nginx", "...": "..."}
  },
  "timings_ms": {
    "dns": 5, "connect": 10, "tls": 15,
    "server": 50, "transfer": 20, "total": 100,
    "namelookup": 5, "initial_connect": 15,
    "pretransfer": 30, "starttransfer": 80
  },
  "speed": { "download_kbs": 1234.5, "upload_kbs": 0.0 },
  "slo": null
}
Use --format jsonl for compact single-line JSON (useful for log pipelines).
Check response times against thresholds. Exits with code 4 on violation:
httpstat httpbin.org/get --slo total=500,connect=100,ttfb=200
Supported keys: total, connect, ttfb (time to first byte), dns, tls.
In pretty mode, violations are printed in red at the end of the output.
In JSON mode, violations appear in the slo field:
{
  "slo": {
    "pass": false,
    "violations": [
      { "key": "total", "threshold_ms": 500, "actual_ms": 823 }
    ]
  }
}
Write structured JSON output to a file (works with any --format):
httpstat httpbin.org/get --save result.json
httpstat httpbin.org/get --format json --save result.json
httpstat has a bunch of environment variables to control its behavior.
Here are some usage demos, you can also run httpstat --help to see full explanation.
HTTPSTAT_SHOW_BODY
Set to true to show response body in the output, note that body length
is limited to 1023 bytes, will be truncated if exceeds. Default is false.
HTTPSTAT_SHOW_IP
By default httpstat shows remote and local IP/port address.
Set to false to disable this feature. Default is true.
HTTPSTAT_SHOW_SPEED
Set to true to show download and upload speed. Default is false.
HTTPSTAT_SHOW_SPEED=true httpstat http://cachefly.cachefly.net/10mb.test

...
speed_download: 3193.3 KiB/s, speed_upload: 0.0 KiB/s
HTTPSTAT_SAVE_BODY
By default httpstat stores body in a tmp file,
set to false to disable this feature. Default is true
HTTPSTAT_CURL_BIN
Indicate the cURL bin path to use. Default is curl from current shell $PATH.
This exampe uses brew installed cURL to make HTTP2 request:
HTTPSTAT_CURL_BIN=/usr/local/Cellar/curl/7.50.3/bin/curl httpstat https://http2.akamai.com/ --http2

HTTP/2 200
...
cURL must be compiled with nghttp2 to enable http2 feature (#12).
HTTPSTAT_METRICS_ONLY
If set to true, httpstat will only output metrics in json format,
this is useful if you want to parse the data instead of reading it.
Note: This is kept for backward compatibility. Prefer
--format jsoninstead.
HTTPSTAT_DEBUG
Set to true to see debugging logs. Default is false
NO_COLOR
When set (to any value), disables all colored output. See no-color.org for the convention.
NO_COLOR=1 httpstat httpbin.org/get
For convenience, you can export these environments in your .zshrc or .bashrc,
example:
export HTTPSTAT_SHOW_IP=false
export HTTPSTAT_SHOW_SPEED=true
export HTTPSTAT_SAVE_BODY=false
Here are some implementations in various languages:
This is the Go alternative of httpstat, it's written in pure Go and relies no external programs. Choose it if you like solid binary executions (actually I do).
Go (library): tcnksm/go-httpstat
Other than being a cli tool, this project is used as library to help debugging latency of HTTP requests in Go code, very thoughtful and useful, see more in this article
Bash: b4b4r07/httpstat
This is what exactly I want to do at the very beginning, but gave up due to not confident in my bash skill, good job!
Node: yosuke-furukawa/httpstat
b4b4r07 mentioned this in his article, could be used as a HTTP client also.
The PHP implementation by @talhasch
Some code blocks in httpstat are copied from other projects of mine, have a look:
reorx/python-terminal-color Drop-in single file library for printing terminal color.
reorx/getenv Environment variable definition with type.
