 k2/ehtrace
ATrace is a tool for tracing execution of binaries on Windows.

EhTrace (pronounced "ATrace") is a high-performance binary tracing and instrumentation framework for Windows. It enables deep runtime analysis of Windows executables without requiring source code, binary modifications, or traditional debugging.
EhTrace leverages Windows Vectored Exception Handling (VEH) and block-stepping techniques to provide comprehensive execution tracing with minimal overhead. Unlike traditional debugging or instrumentation tools, EhTrace operates entirely in-process and requires no patches to target binaries.
flowchart TB
    subgraph Target["🎯 Target Process"]
        direction TB
        APP[Application Code]
        VEH[Vectored Exception Handler]
        style APP fill:#e1f5ff,stroke:#01579b,stroke-width:3px,color:#000
        style VEH fill:#fff3e0,stroke:#e65100,stroke-width:3px,color:#000
    end

    subgraph EhTrace["⚡ EhTrace Engine"]
        direction TB
        BLOCK[Block Stepper]
        DISASM[Capstone Disassembler]
        FIGHTERS[BlockFighters]
        CTX[Context Manager]
        style BLOCK fill:#f3e5f5,stroke:#4a148c,stroke-width:3px,color:#000
        style DISASM fill:#e8f5e9,stroke:#1b5e20,stroke-width:3px,color:#000
        style FIGHTERS fill:#ffebee,stroke:#b71c1c,stroke-width:3px,color:#000
        style CTX fill:#e0f2f1,stroke:#004d40,stroke-width:3px,color:#000
    end

    subgraph Output["📊 Analysis Output"]
        direction TB
        SHMEM[Shared Memory Log]
        GRAPHS[Visual Graphs]
        REPORTS[Coverage Reports]
        style SHMEM fill:#fce4ec,stroke:#880e4f,stroke-width:3px,color:#000
        style GRAPHS fill:#f1f8e9,stroke:#33691e,stroke-width:3px,color:#000
        style REPORTS fill:#fff8e1,stroke:#f57f17,stroke-width:3px,color:#000
    end

    APP -->|Exception| VEH
    VEH -->|Single Step| BLOCK
    BLOCK -->|Instruction| DISASM
    DISASM -->|Analysis| FIGHTERS
    FIGHTERS -->|State| CTX
    CTX -->|Events| SHMEM
    SHMEM -->|Data| GRAPHS
    SHMEM -->|Data| REPORTS

    style Target fill:#e3f2fd,stroke:#0d47a1,stroke-width:4px
    style EhTrace fill:#f3e5f5,stroke:#6a1b9a,stroke-width:4px
    style Output fill:#e8f5e9,stroke:#2e7d32,stroke-width:4px
EhTrace operates through a sophisticated pipeline:
The framework maintains execution state per-thread using specialized context structures and provides hooks for customizable instrumentation.
graph LR
    subgraph Traditional["🐌 Traditional Debugger"]
        T1[Single Step]
        T2[Context Switch]
        T3[Kernel Mode]
        T4[~1M events/sec]
        style T1 fill:#ffcdd2,stroke:#c62828,stroke-width:2px,color:#000
        style T2 fill:#ffcdd2,stroke:#c62828,stroke-width:2px,color:#000
        style T3 fill:#ffcdd2,stroke:#c62828,stroke-width:2px,color:#000
        style T4 fill:#ef5350,stroke:#b71c1c,stroke-width:3px,color:#fff
    end

    subgraph EhTrace["⚡ EhTrace"]
        E1[Block Step]
        E2[In-Process]
        E3[User Mode]
        E4[~43M events/sec]
        style E1 fill:#c8e6c9,stroke:#2e7d32,stroke-width:2px,color:#000
        style E2 fill:#c8e6c9,stroke:#2e7d32,stroke-width:2px,color:#000
        style E3 fill:#c8e6c9,stroke:#2e7d32,stroke-width:2px,color:#000
        style E4 fill:#66bb6a,stroke:#1b5e20,stroke-width:3px,color:#fff
    end

    T1 --> T2 --> T3 --> T4
    E1 --> E2 --> E3 --> E4

    style Traditional fill:#ffebee,stroke:#d32f2f,stroke-width:3px
    style EhTrace fill:#e8f5e9,stroke:#388e3c,stroke-width:3px
EhTrace achieves high performance through several optimizations:
📊 Benchmark: 428,833,152 events (32 bytes each) captured in 10 seconds = ~43M events/sec
CSW16 demo tracing notepad.exe without symbols:
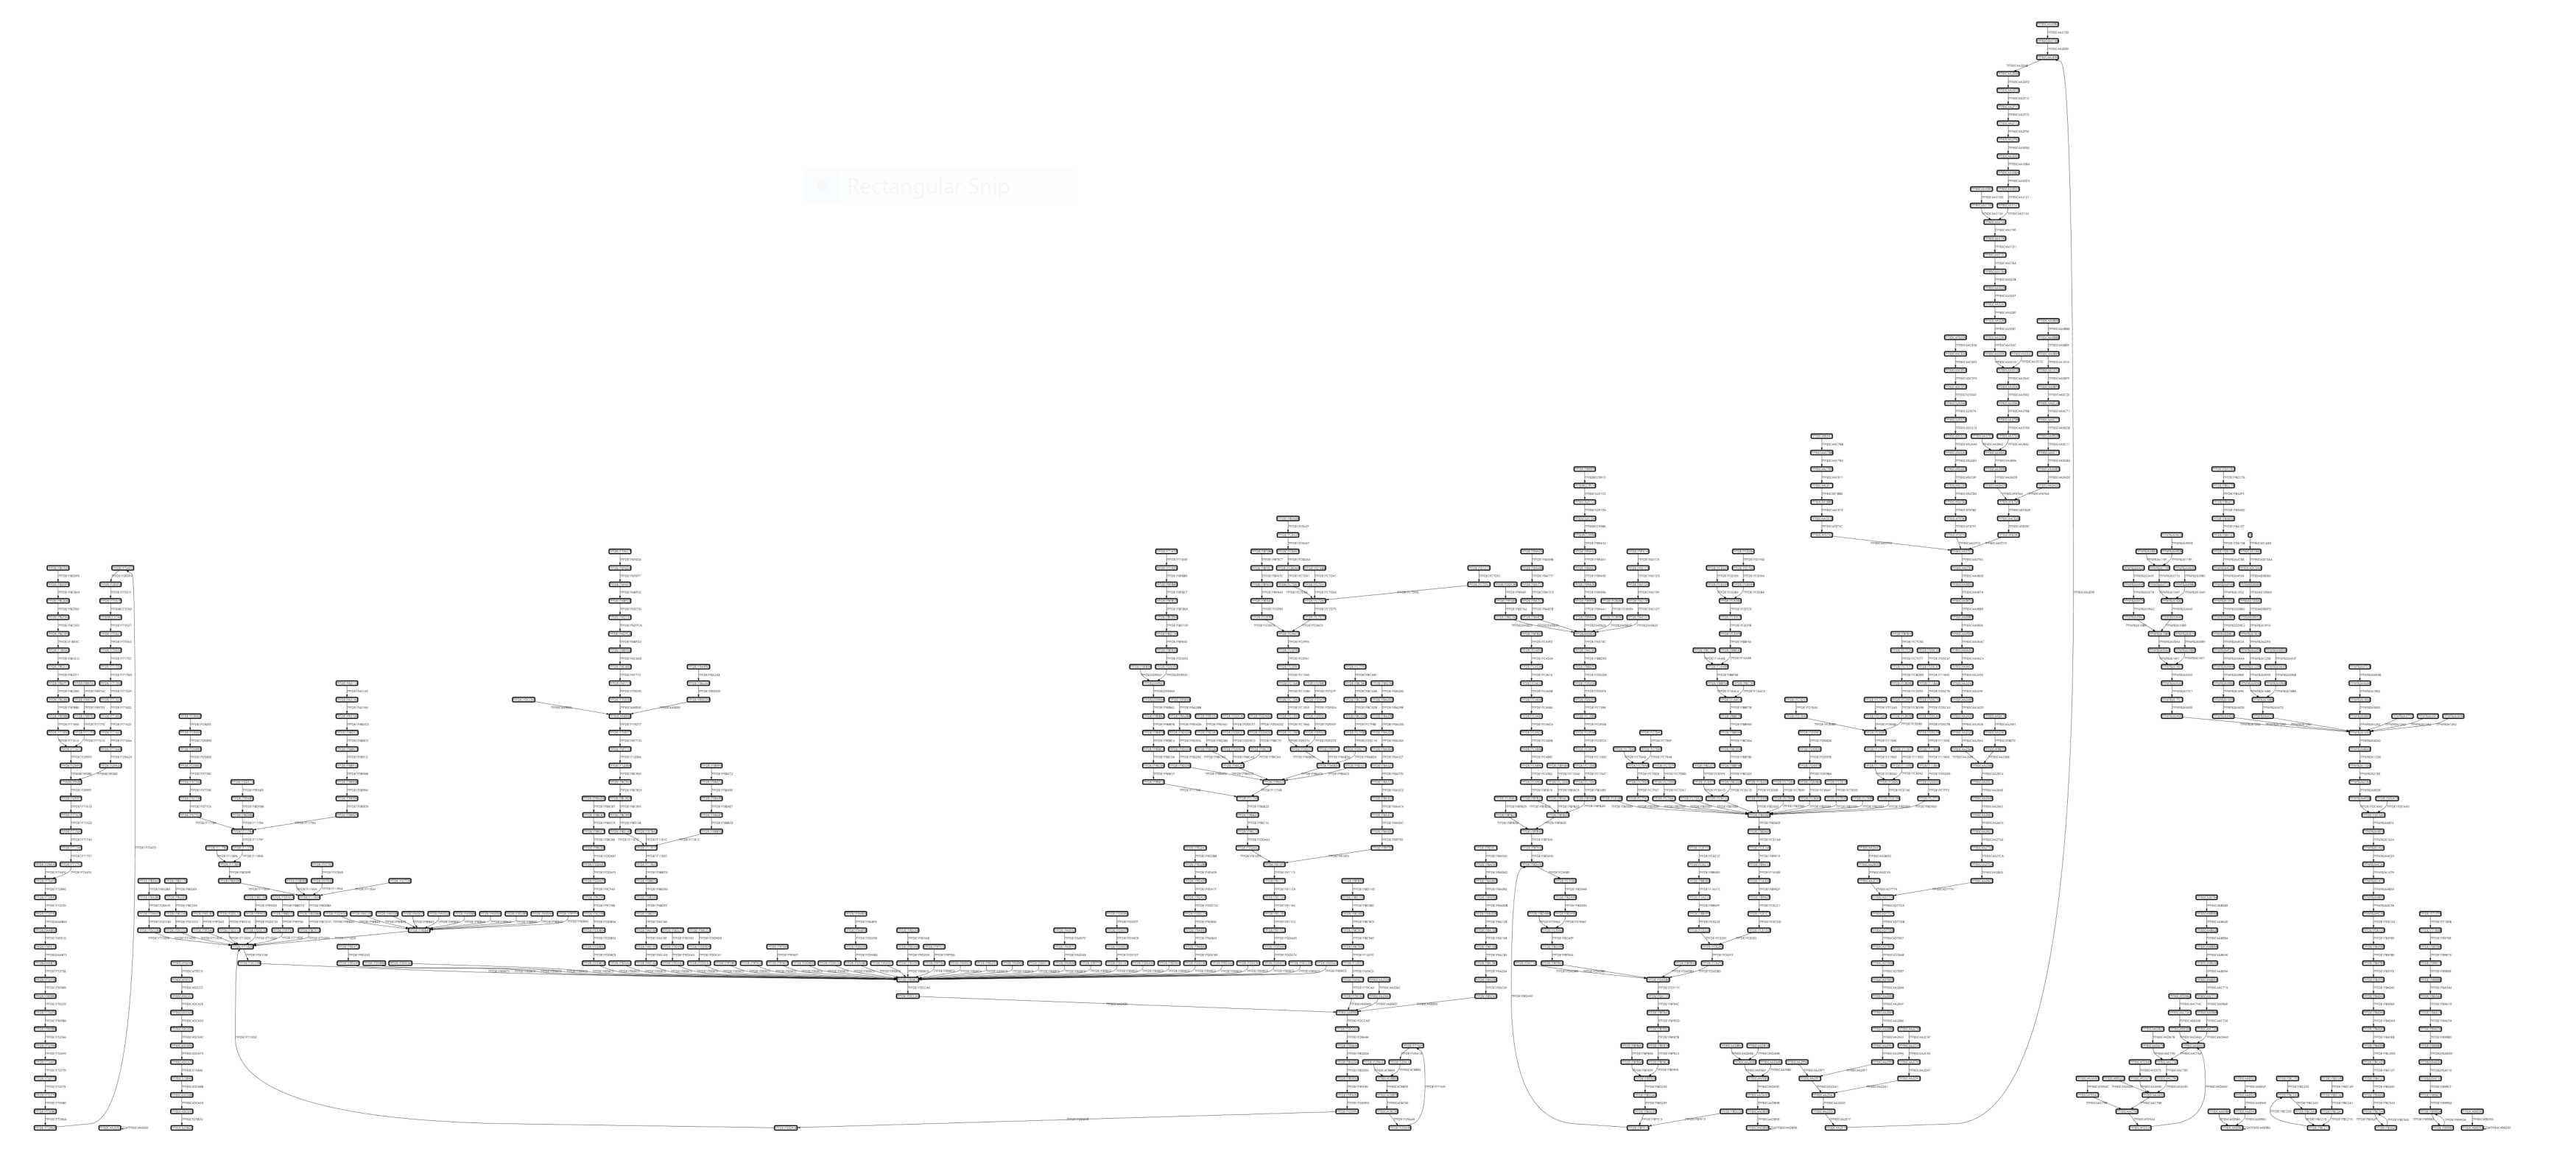
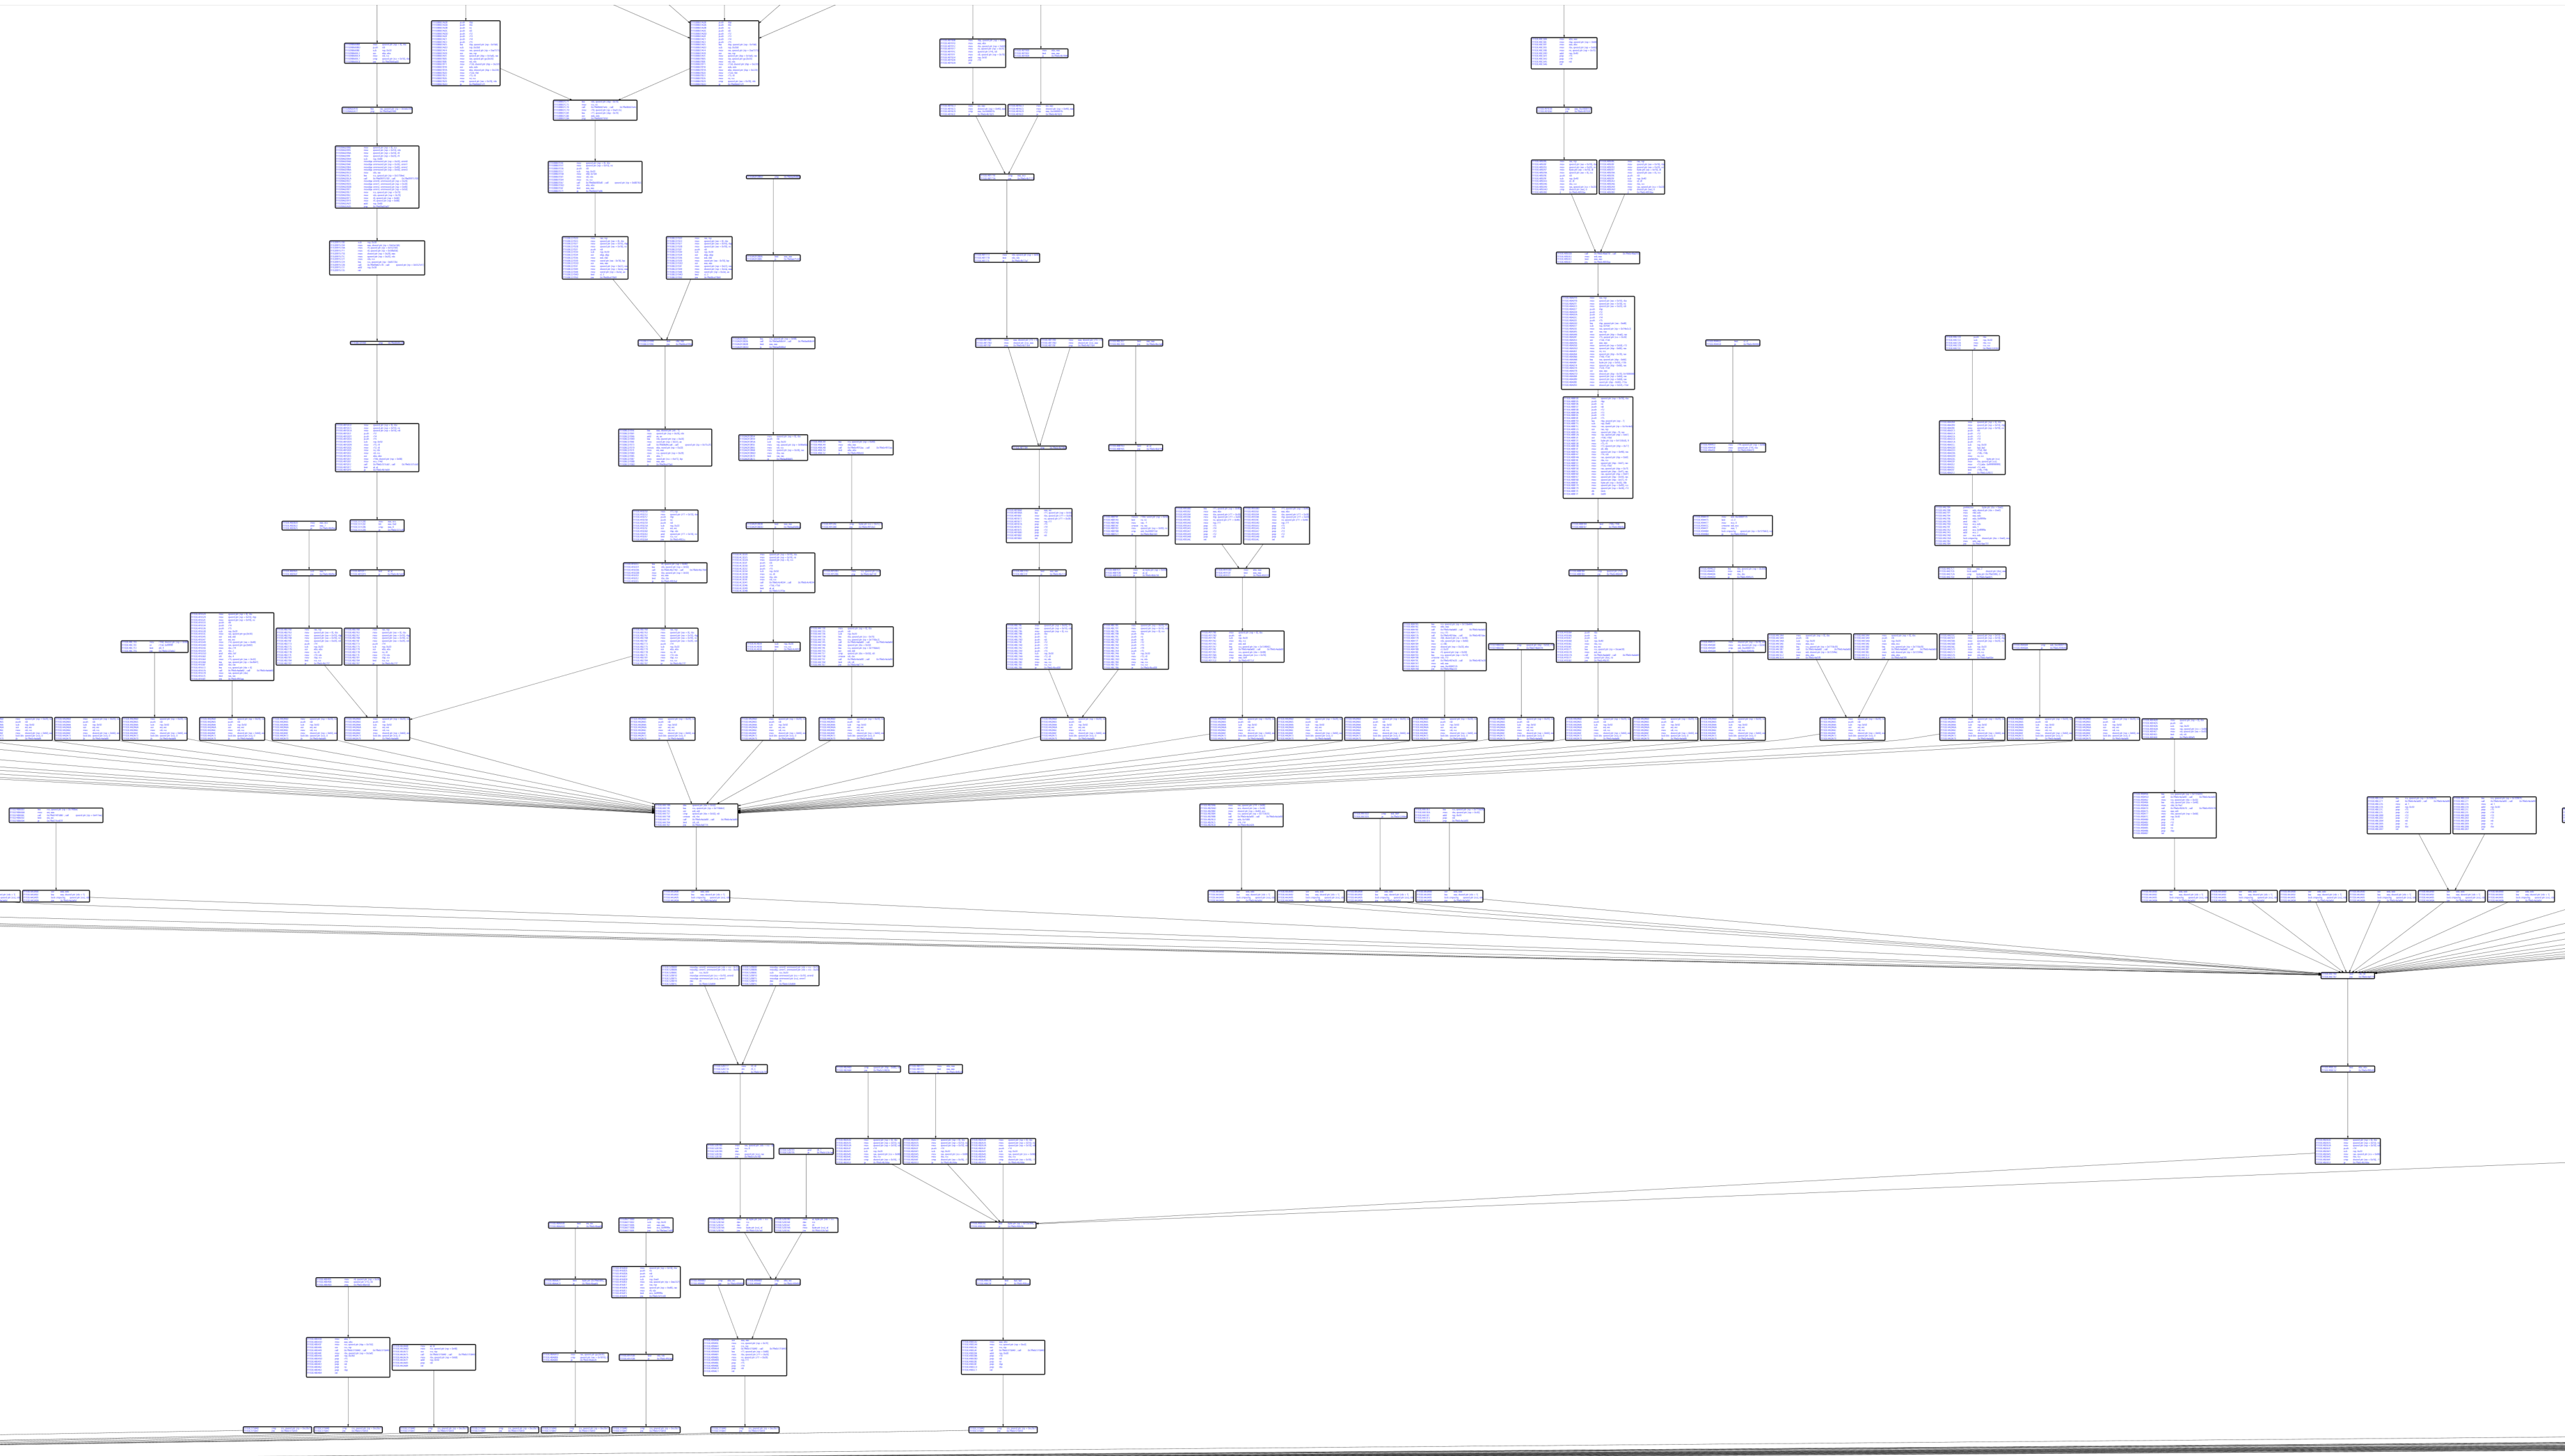
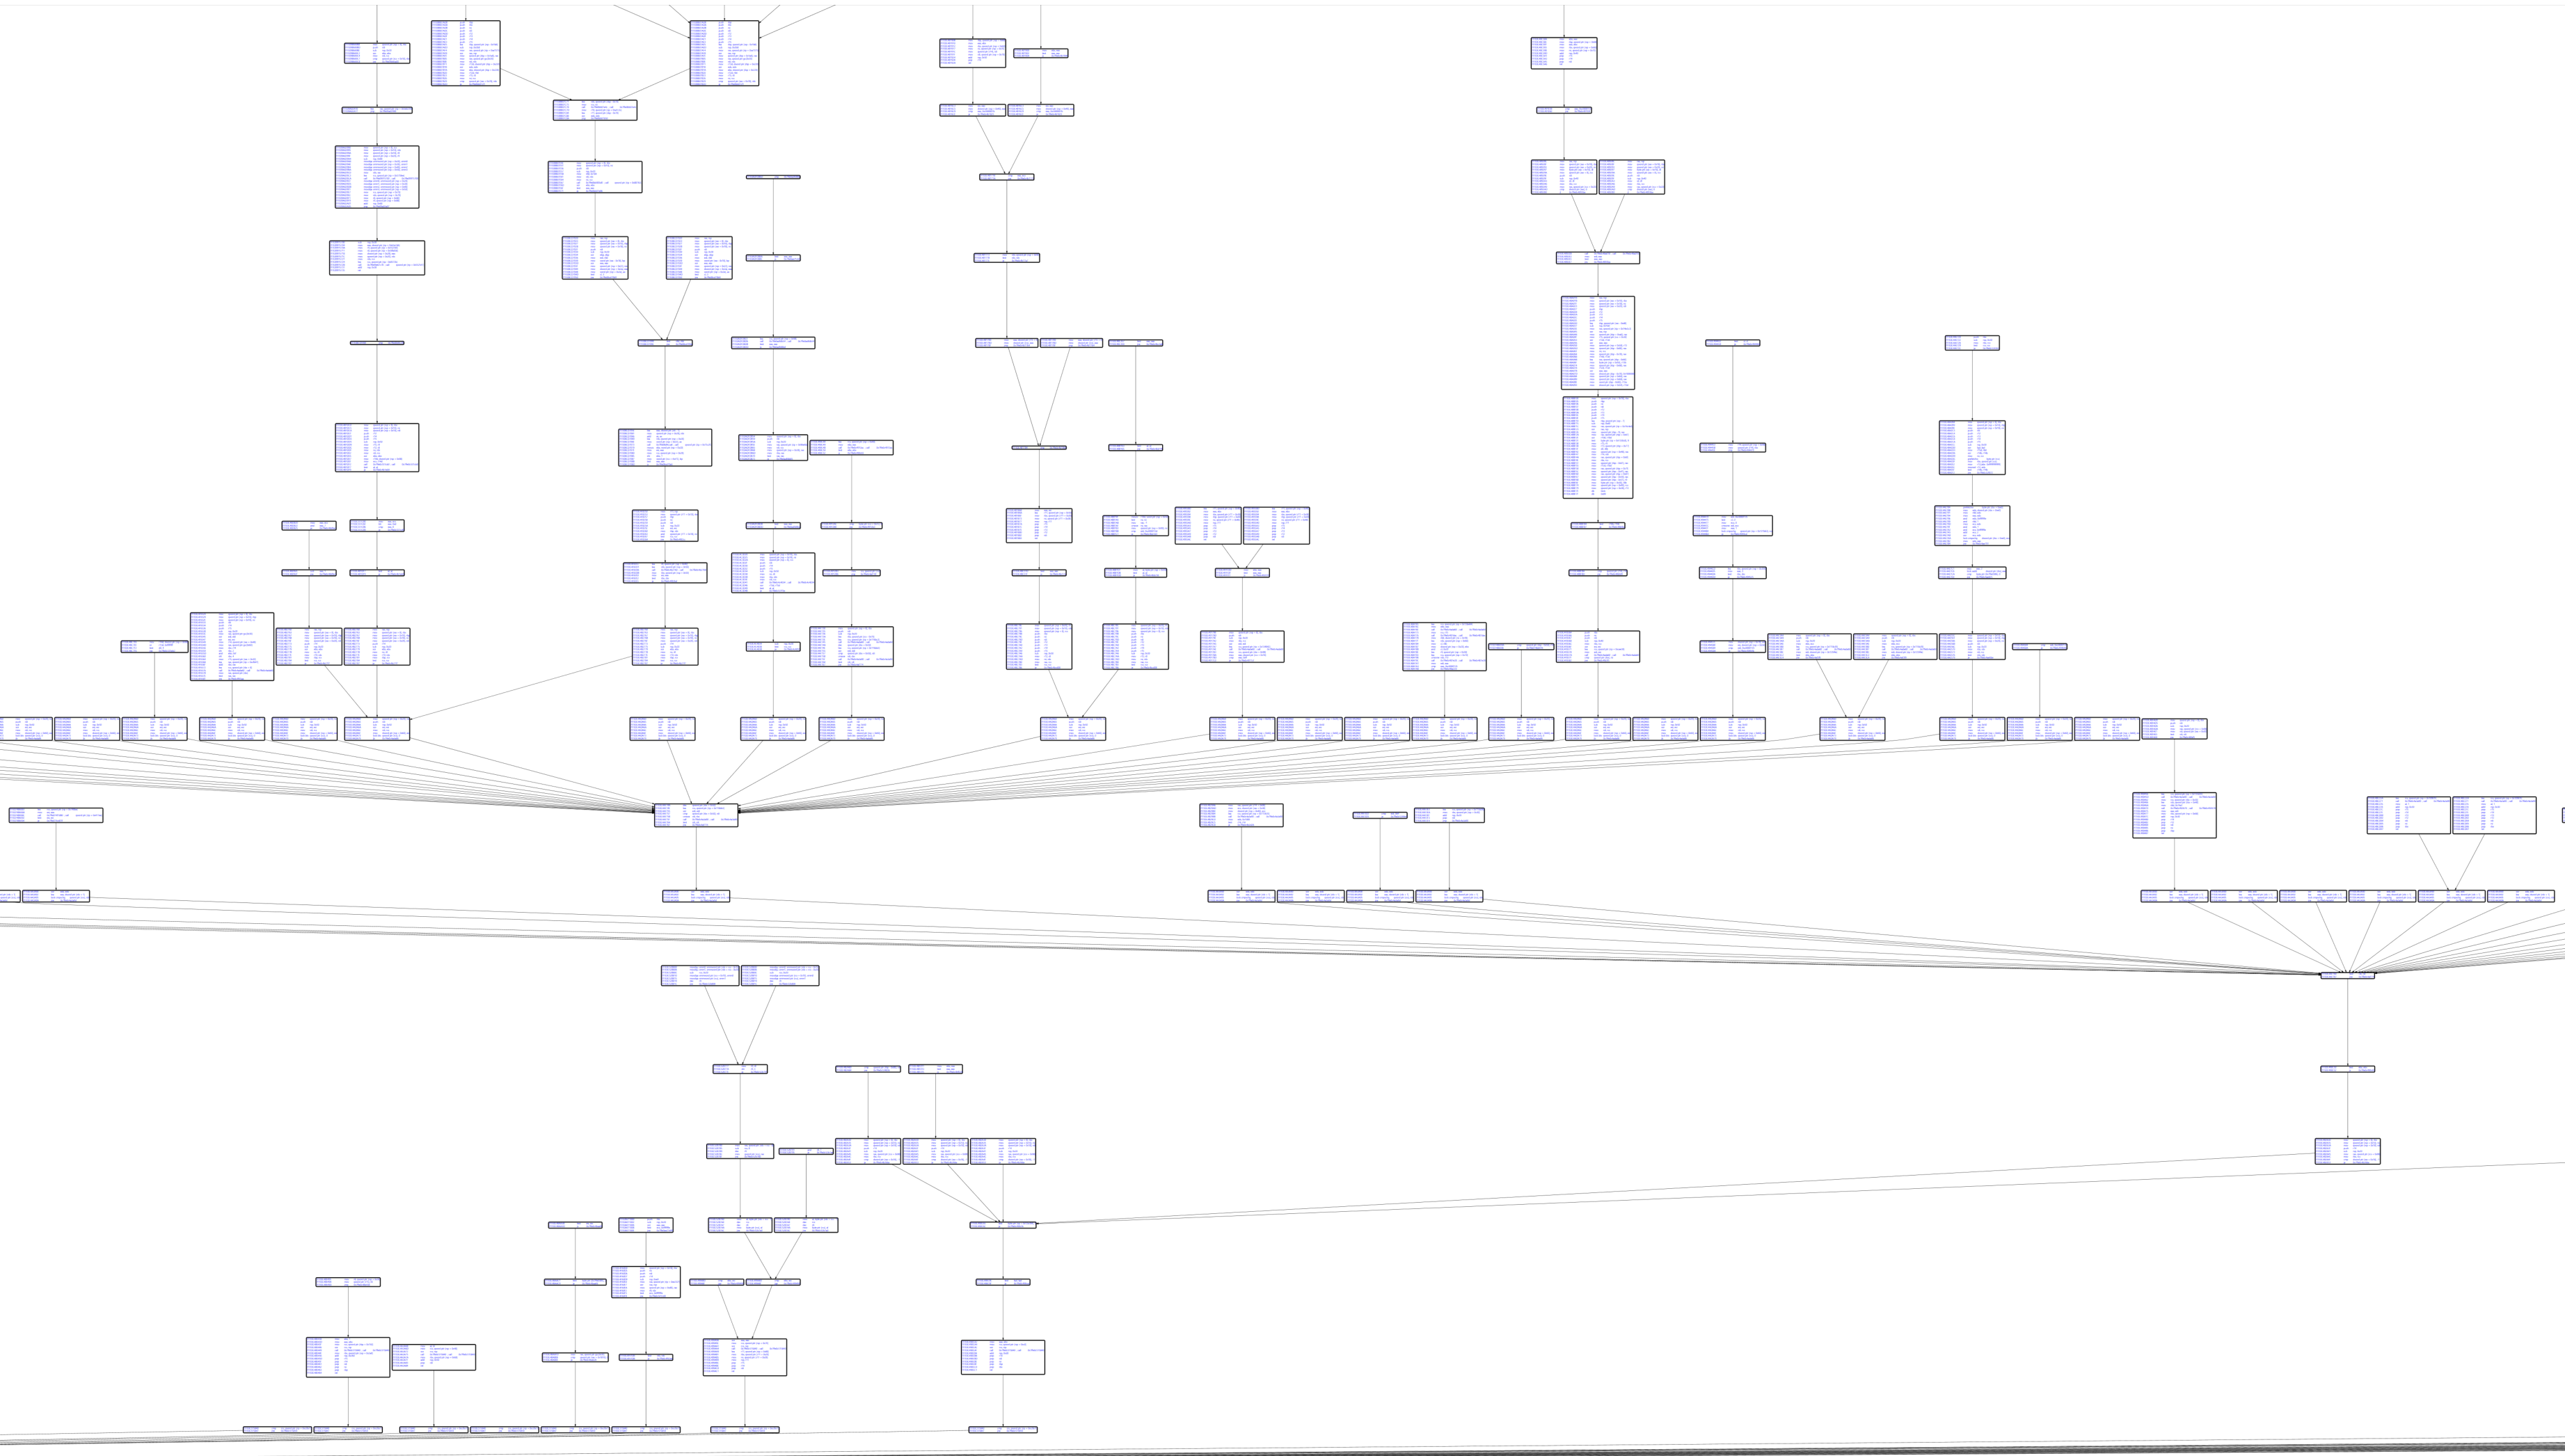
Basic block graph with Capstone disassembly:
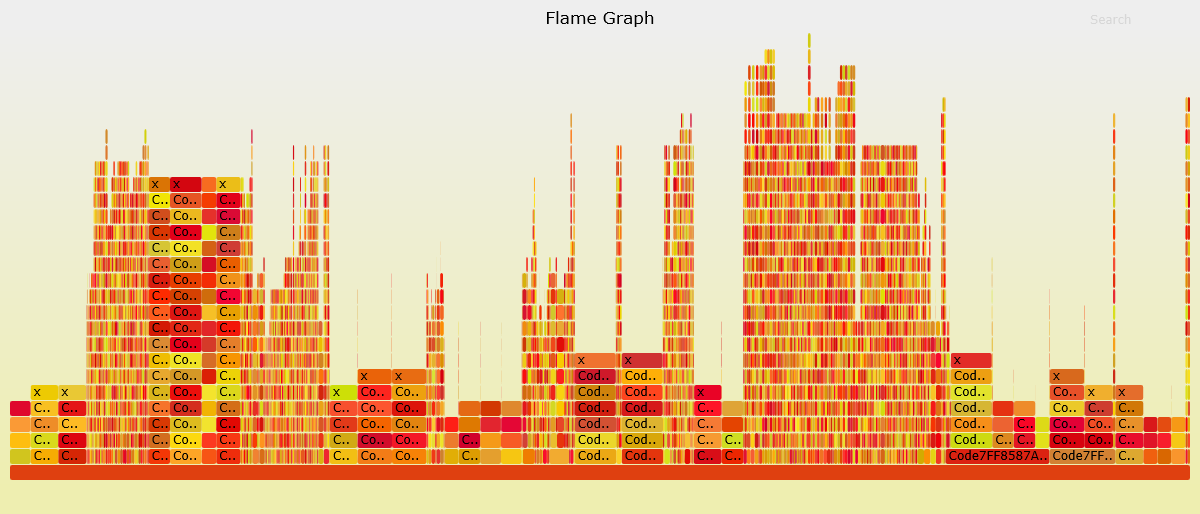
Code coverage visualization: