 jurelou/epagneul
Graph Visualization for windows event logs

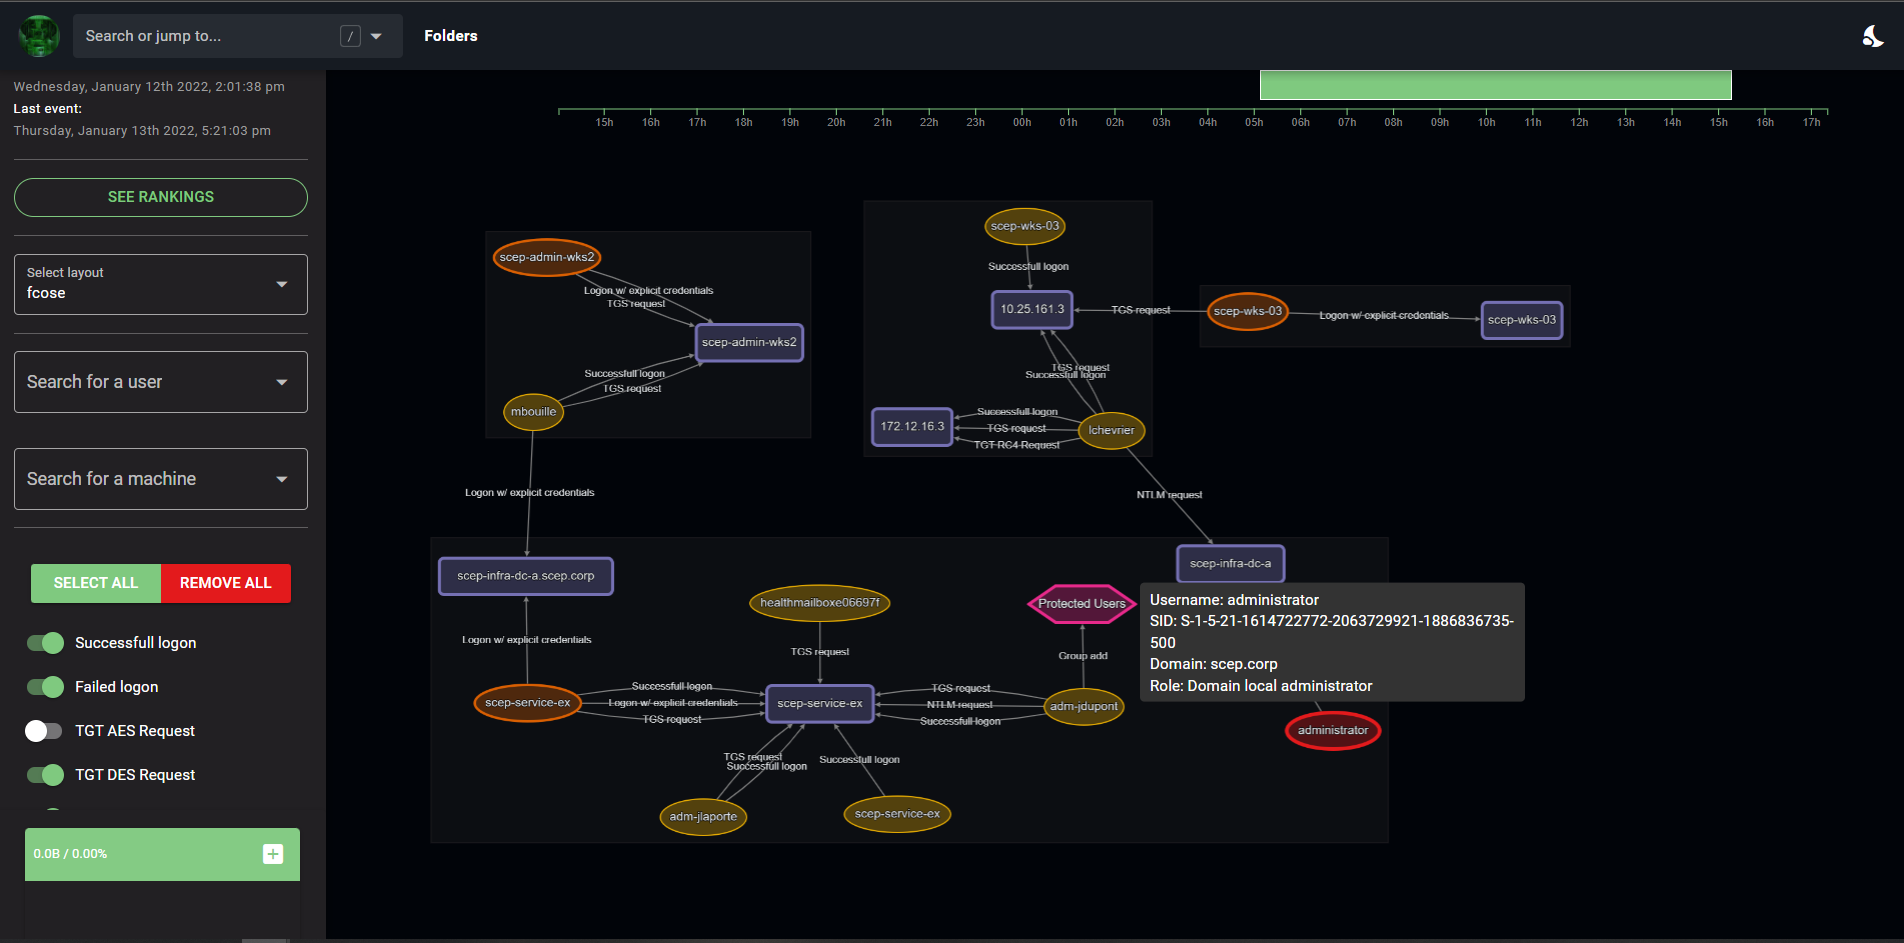
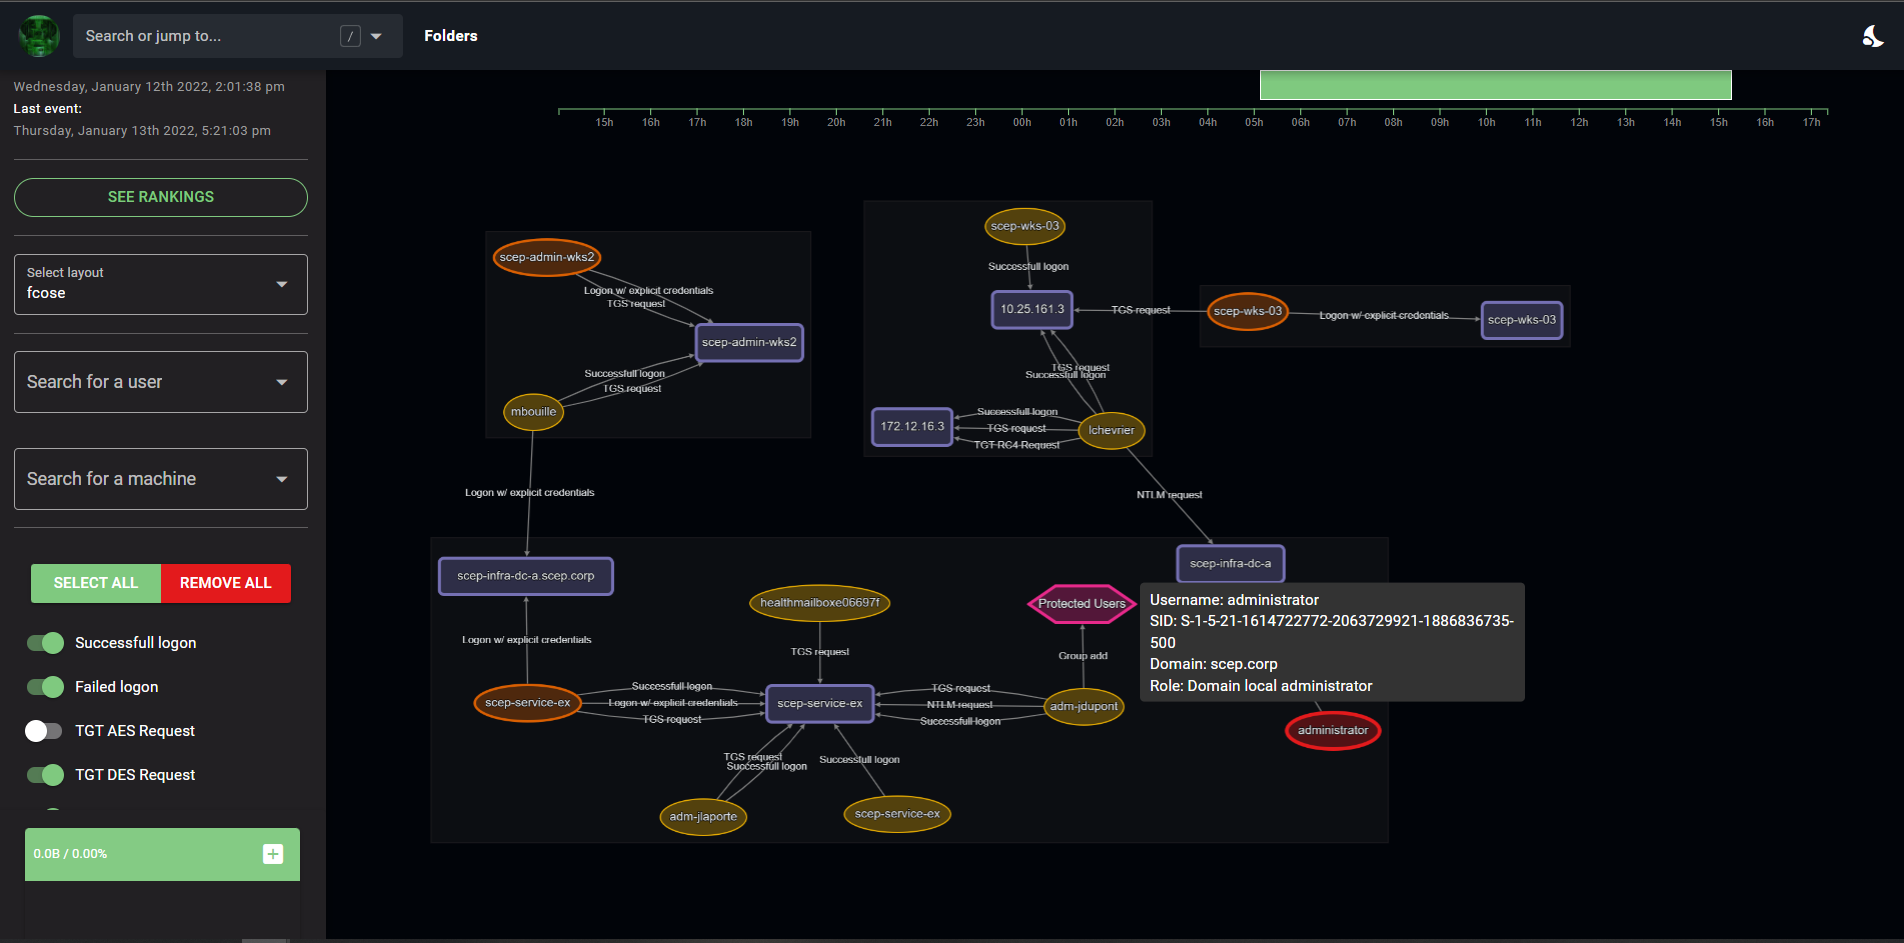
Epagneul is a tool to visualize and investigate windows event logs.


Requires docker and docker-compose to be installed.
make
On a machine connected to internet, build an offline release:
make release
This will create a release folder containing ready to go docker images.
Copy the project to your air gapped machine then run:
make load
make
This will install:
The project includes a Python utility to upload EVTX or JSONL files to Epagneul for analysis.
Run the following command to use the tool:
python upload.py --input-path <path_to_file_or_folder> --folder-name <folder_name> --console-url <console_url> [--console-port <port>]
--input-path: Path to the file or folder containing EVTX or JSONL files.--folder-name: Name of the folder to create in Epagneul.--console-url: Base URL of the Epagneul backend (e.g., http://127.0.0.1).--console-port: Port of the Epagneul backend (default: 6327).3,4648,4624,4625,4672,4768,4769,4771,4776,4728,4732,4756count value on edges does not update based on the selected timeline