HTTP Breakout Proxy
A lightweight HTTP/HTTPS intercepting proxy and traffic analysis tool written in Go, with a web-based UI for inspecting, filtering, coloring, and annotating captured traffic in real time.
Overview
HTTP Breakout Proxy functions as both an HTTP and HTTPS MITM proxy and a live visualization tool.
It captures requests and responses between two software components, allowing developers to:
- Inspect headers, bodies, and timing details for each request and response.
- Organize, filter, and persist captured data.
- Highlight requests based on user-defined color rules.
- Pause or resume capture dynamically.
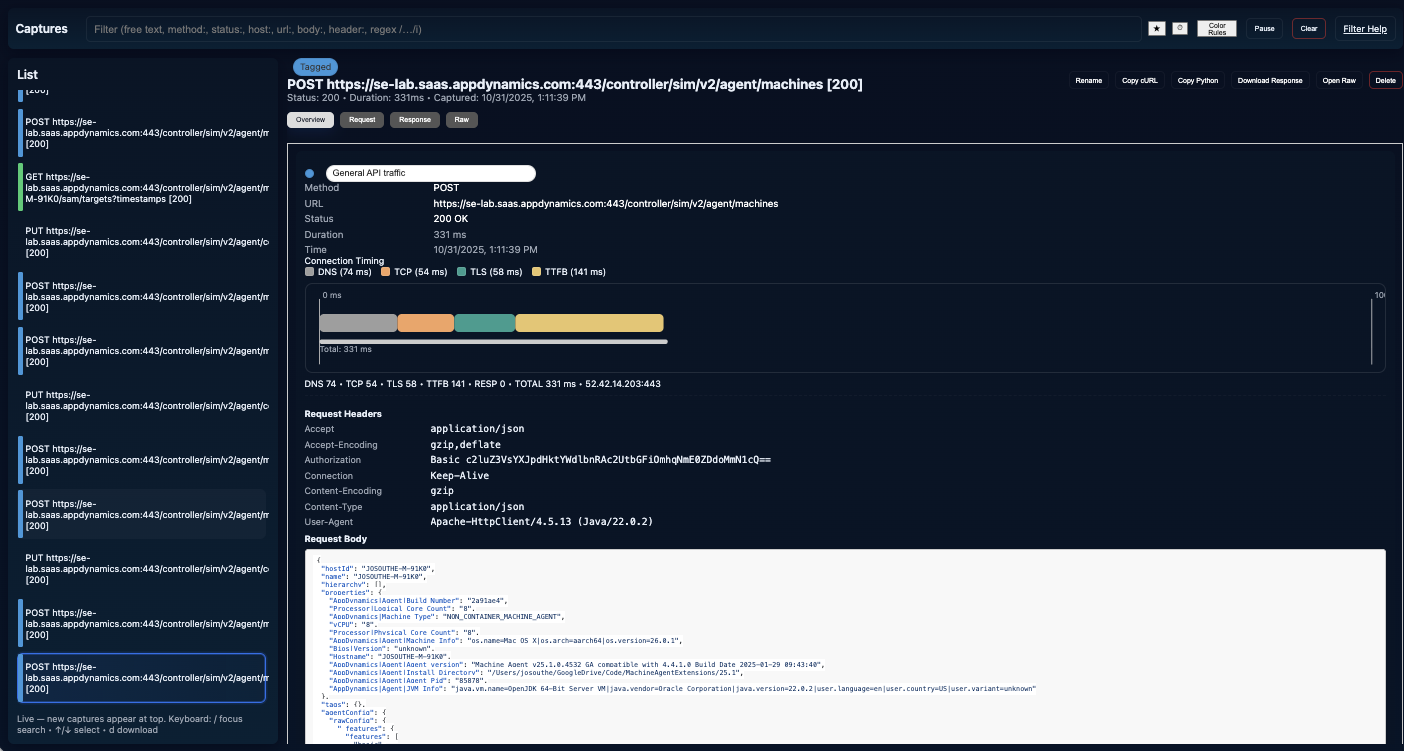
- View request timing as a Gantt chart to visualize performance phases.
The proxy embeds a full-featured UI accessible from any modern web browser, enabling immediate, real-time analysis without external tools.
Features
🔍 Capture and Inspection
- Intercepts both HTTP and HTTPS traffic (with MITM CA support).
- Displays all request and response metadata, headers, and bodies.
- Supports truncation for very large bodies.
💾 Persistence
- Captures and color rules are stored in
captures.json (or specified file).
- Automatically reloads state at startup and periodically saves to disk.
- Default color rules are generated on first run if none exist.
🖥️ Web UI
- Responsive embedded web interface (served by the proxy itself).
- Displays captures in a scrollable list with color-coded indicators.
- Details panel shows:
- Request and response headers/bodies
- Timing breakdowns
- Editable notes
- Gantt-style performance chart for connection phases
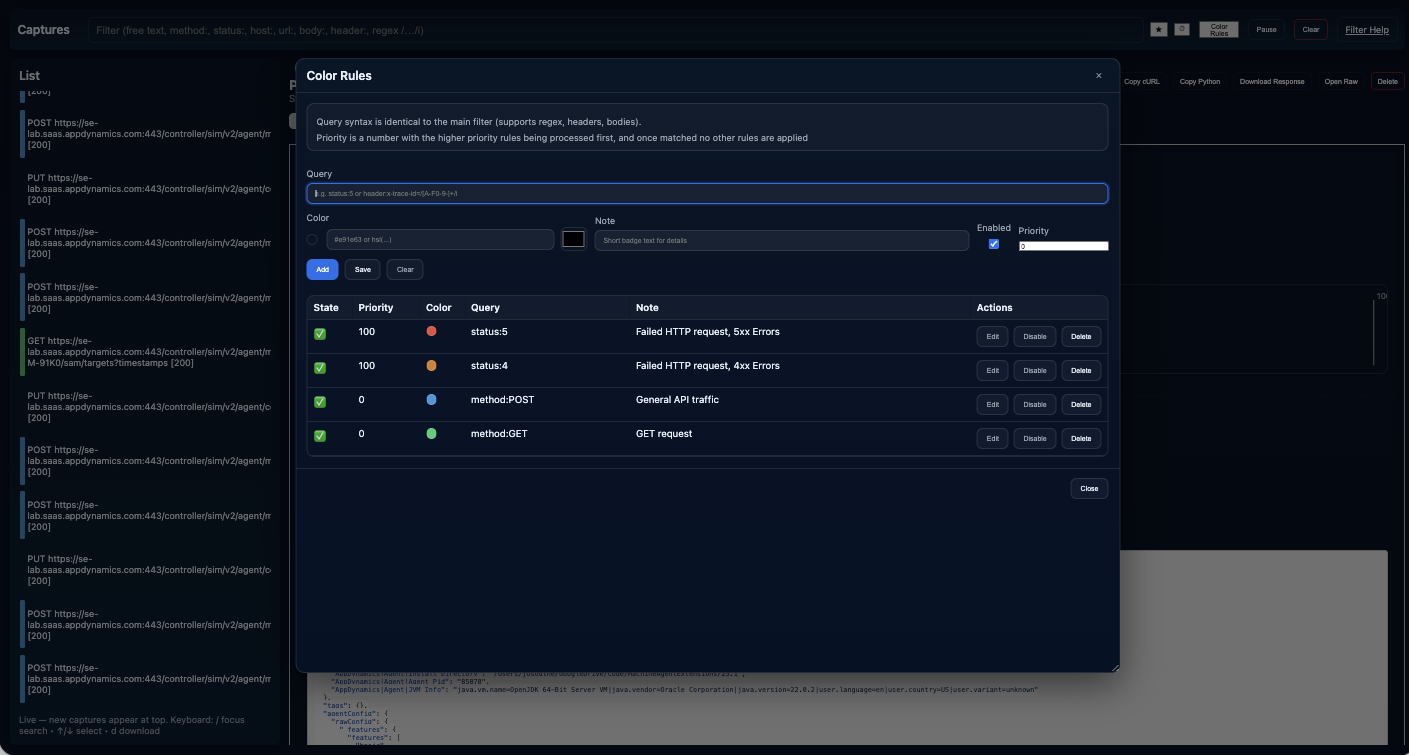
🎨 Color Rules
- Define conditional color highlights for captures using flexible filter syntax:
- Example:
status:4 status:5 → highlights HTTP errors
- Example:
url:/api/ → highlights API requests
- Example:
/\.css$/ → regex match on URL
- Each rule includes:
- Name, color, match expression, priority, and note
- Highest-priority match wins.
- Managed interactively through a modal UI with live previews.
- Persisted across sessions.
⏸️ Capture Control
- Pause/Resume button allows you to stop collecting new captures without stopping the proxy.
- Useful when focusing on a fixed dataset or isolating specific behavior.
- Each capture includes detailed connection timing:
- DNS lookup
- TCP connect
- TLS handshake
- Server processing
- Response read
- Displayed as a Gantt chart in the details panel.
- Scale automatically rounds to the nearest second for readability.
🧭 Filtering and Search
- Real-time filter box supporting:
- Field-based filters (
method:GET, status:404, header:Content-Type=application/json)
- Regex expressions (
/login/)
- Combined terms with AND/OR semantics
- Case-insensitive and partial matching supported.
- Filter applies both to the capture list and color highlighting.
- Search history stored locally in the browser.
🧹 Management
- Delete individual captures or clear all captures via UI.
- Rules and notes are persisted along with captures.
🧩 Export Utilities
- Copy a capture as:
curl command (formatted for terminal)python requests code snippet (clean JSON representation)
- Download response bodies directly from the UI.
Command Line Usage
httpbreakout -l 127.0.0.1:8080
Quick Start
Build (from source)
git clone https://github.com/jbsouthe/http-breakout-proxy.git
cd http-breakout-proxy
go build -o http-breakout-proxy
This produces a single executable that contains the compiled proxy and the embedded UI assets.
Run (default)
# run with defaults (proxy + UI)
./http-breakout-proxy
By default the binary binds to 127.0.0.1:8080 for proxying (and optionally UI — see CLI flags). Open the UI in a browser to inspect captures.
Example: exercising the proxy with curl
# send an HTTPS request via the proxy (proxy listens on 127.0.0.1:8080)
curl -x http://127.0.0.1:8080 https://example.com
Captured traffic will appear in the web UI.
Command-Line Arguments
| Flag | Default | Description |
|---|
-l | 127.0.0.1:8080 | Address for the proxy to listen on as well as a UI app. |
-mitm | true | Enable HTTPS Man In The Middle mode (MITM) interception (generates a local CA for intercepting TLS). |
-ca | ./ca | Directory in which generated CA certificate and key are stored when MITM is enabled and persistence is chosen. |
-f | ./captures.json | Optional path or directory for persisting captures to disk (e.g., ./captures.json). |
-max-body | 1048576 | Maximum number of bytes (per body) to store/display; larger bodies are truncated with a sentinel. |
-buffer-size | 1000 | Circular buffer capacity for in-memory captures. |
-v | false | Enable verbose logging for debugging. |
Use ./http-breakout-proxy -h to list available flags and usage descriptions.
Web UI Overview
The UI is optimized for investigative workflows.
- Top toolbar: global filter input (supports regex and keyed prefixes), Pause/Resume capture, Clear, and Filter Help (opens in a new tab).
- Left panel: chronological capture listing (newest first). Each item shows the capture name; by default this is
METHOD URL [STATUS] but a custom name can be assigned.
- Right panel: details for the selected capture:
- Overview: metadata, headers, and bodies (formatted JSON where applicable).
- Request / Response tabs: raw formatted bodies.
- Raw tab: full capture JSON.
- Row actions: copy as
curl, copy as Python requests, download response body, rename, delete.
Filter Language (Short Reference)
- Plain token: matches anywhere (method, URL, status, host, headers, bodies).
- Prefixes:
method:, status:, host:, url:, body:, req.body:, resp.body:, header:, req.header:, resp.header:.
- Regex syntax:
/pattern/flags (for example /bearer\\s+\\S+/i).
- Header spec:
header:name=value where name or value can be regexes.
- Terms are combined with logical AND by default (space separated). Switch to OR if desired by altering client logic.
Examples:
method:POST status:2 host:api.example.com/token\\s*[:=]\\s*\\S+/ireq.header:authorization=/bearer/ibody:/\\"success\\"\\s*:\\s*true/i
HTTPS Interception (MITM)
When Man In The Middle mode is enabled:
- The proxy generates an RSA CA key pair and a root certificate and stores them in
-ca (default ./ca).
- To inspect HTTPS traffic you must add the generated CA certificate (
ca.pem or similar) to the trust store of the client (or system) issuing requests. On many platforms this requires administrative privileges.
- The proxy performs TLS interception by issuing leaf certificates signed by the local CA for each hostname requested by the client.
Security note: Only install the CA in controlled environments. Do not trust this CA in systems where you read sensitive unrelated traffic.
 jbsouthe/http-breakout-proxy
