 jaronmcd/meshyface
Single-page web dashboard for Meshtastic mesh networks with live network mapping, packet analysis, chat, sensor telemetry, and topology visualization. Runs as a Python service with SQLite-backed history.

Meshyface is a chat-first Meshtastic dashboard that runs as a single Python service and serves a single-page web UI over HTTP.
The current UI exposes:
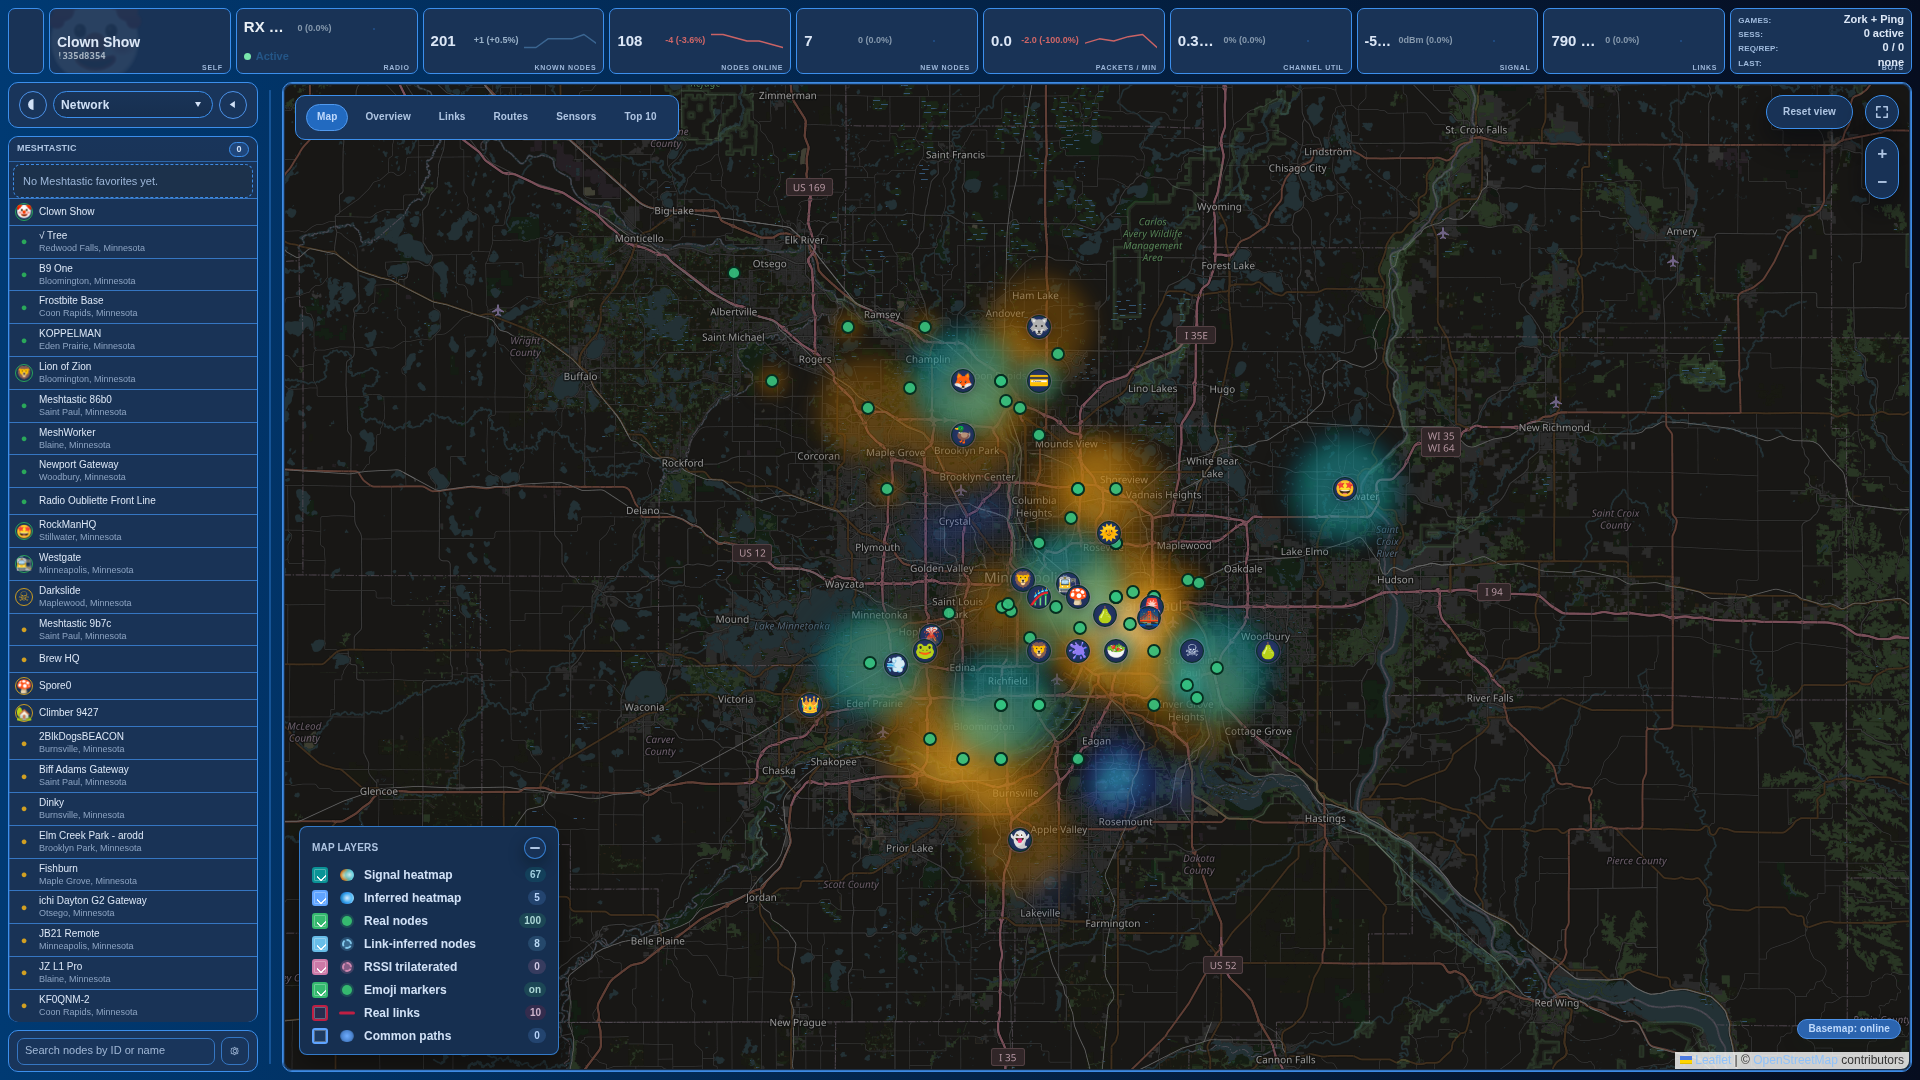
The Console workspace is a terminal-style control surface for packet traffic, history search, and mesh utility commands.
Tab or Enter
to accept, ArrowRight to accept the ghosted suffix, and ArrowUp /
ArrowDown to move through the popup.! narrows by node ID.live streams packet traffic until Ctrl+C or q. Use
live grep <text>, live rg <text>, live filter=<text>, or bare
live <text> to stream only matching live packet groups. Layer and
verbosity filters still apply, for example
live rg TEXT_MESSAGE_APP -vv --layer=2.grep <text> and rg <text> search retained packet/chat history with
context windows, limits, packet/chat source filters, and summary/packet
scope filters./search <text> filters the visible console output from the prompt without
starting a retained-history search.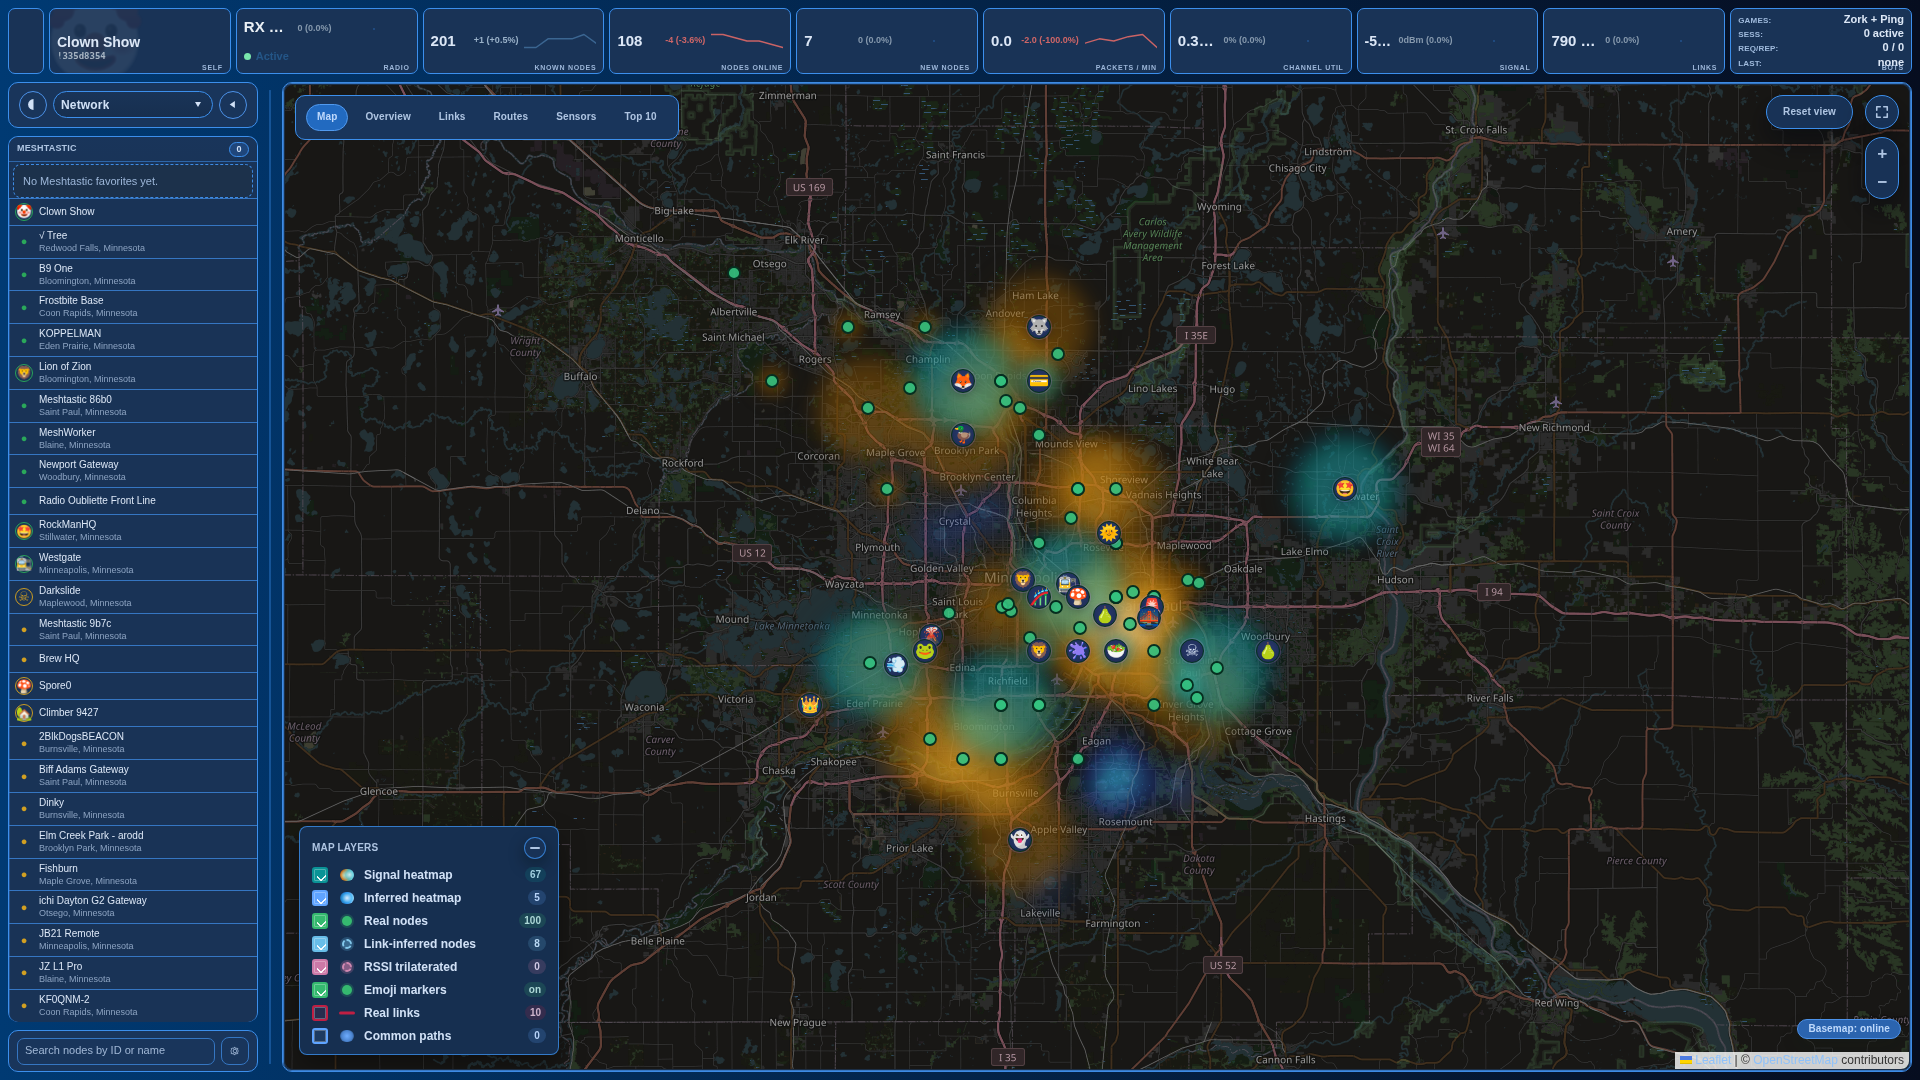
Map view with node locations, links, common paths, clusters, and signal heatmap.
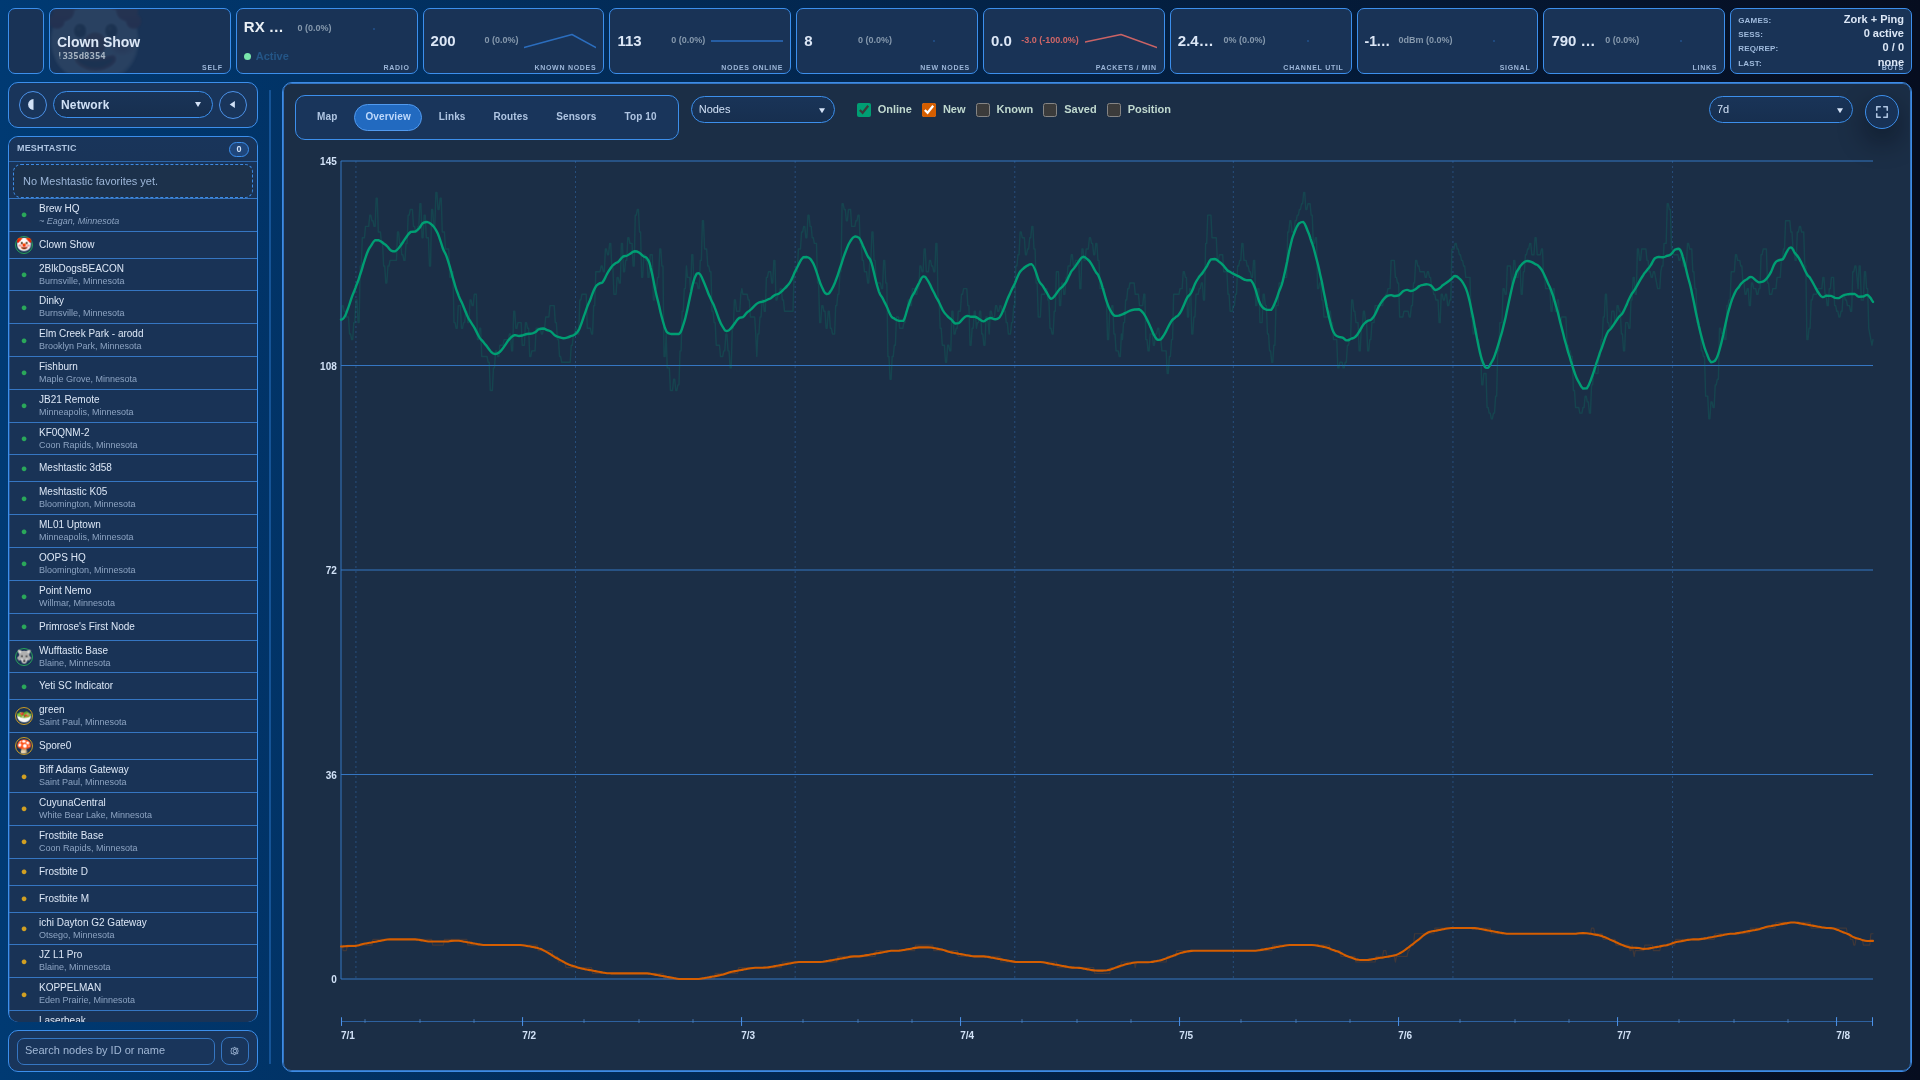
History view for node counts, online status, new nodes, and position reports.
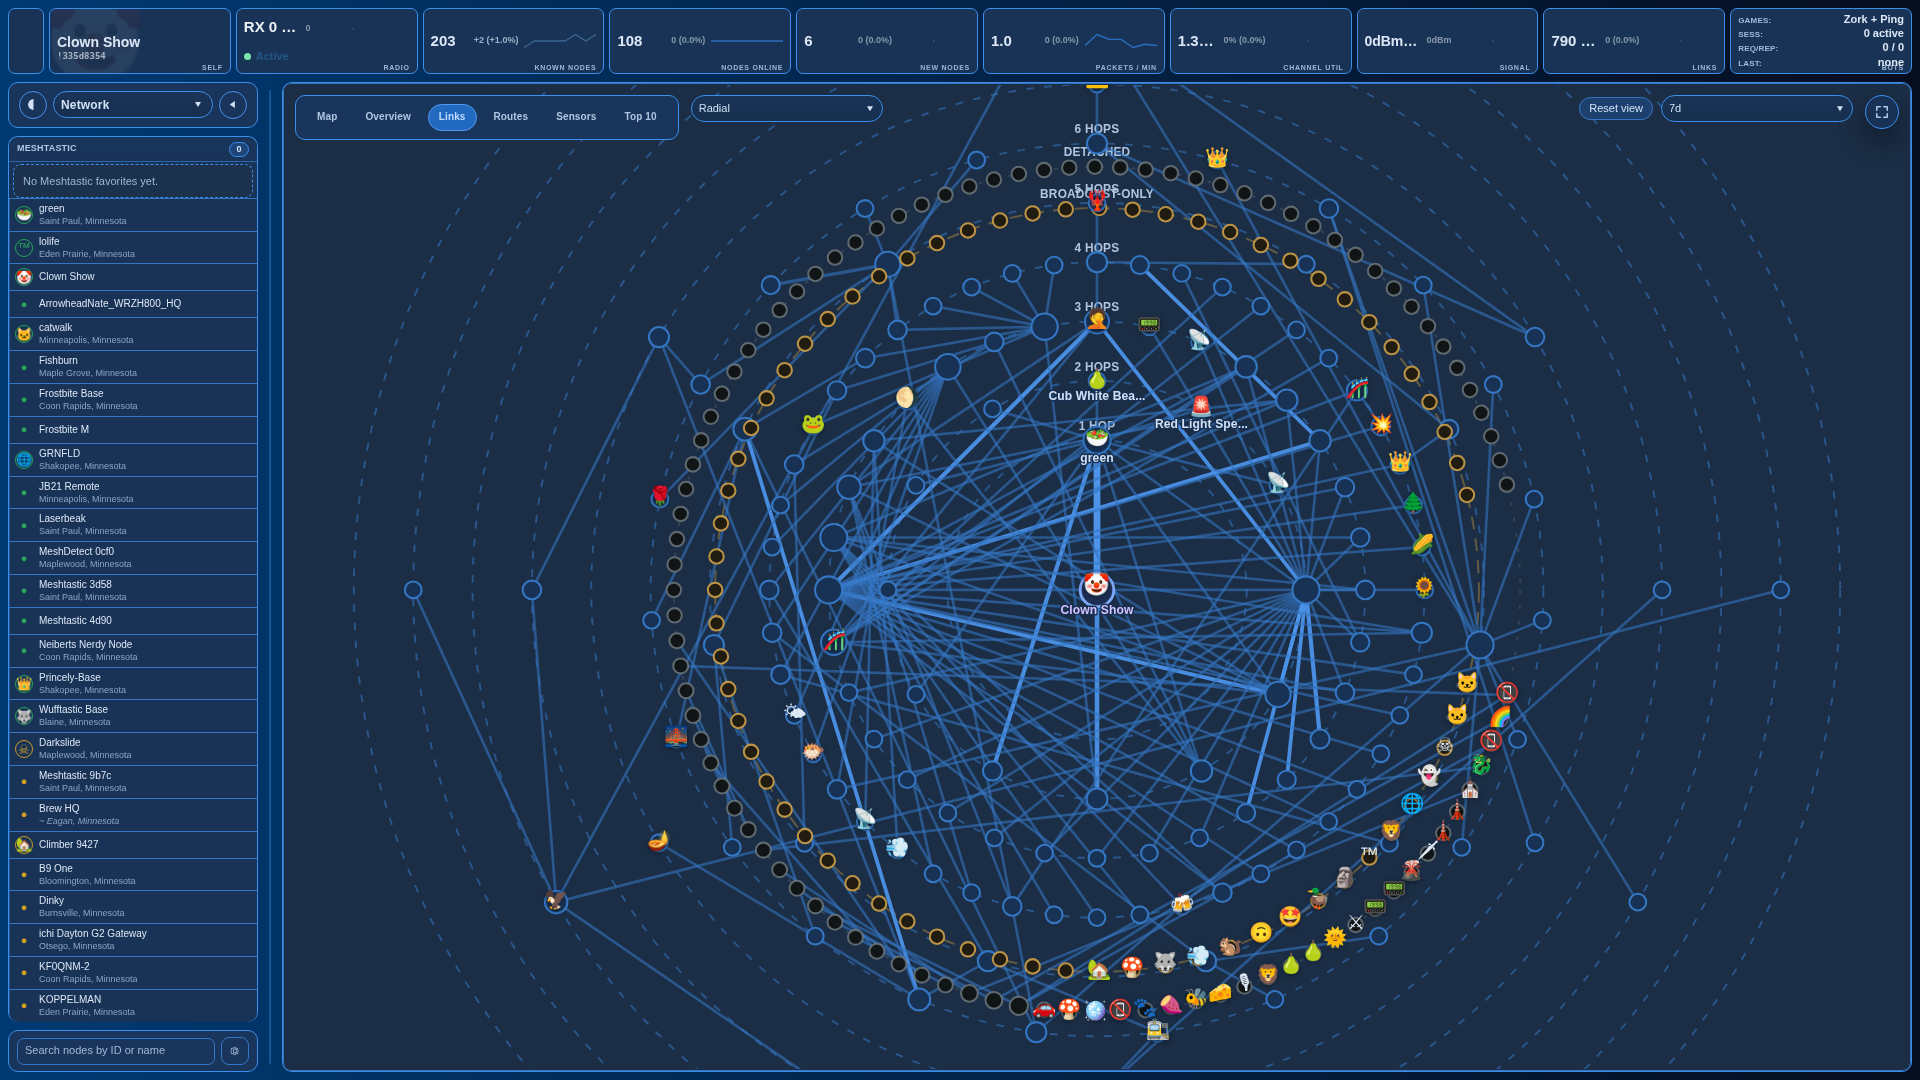
Topology view showing observed links from the selected root node.
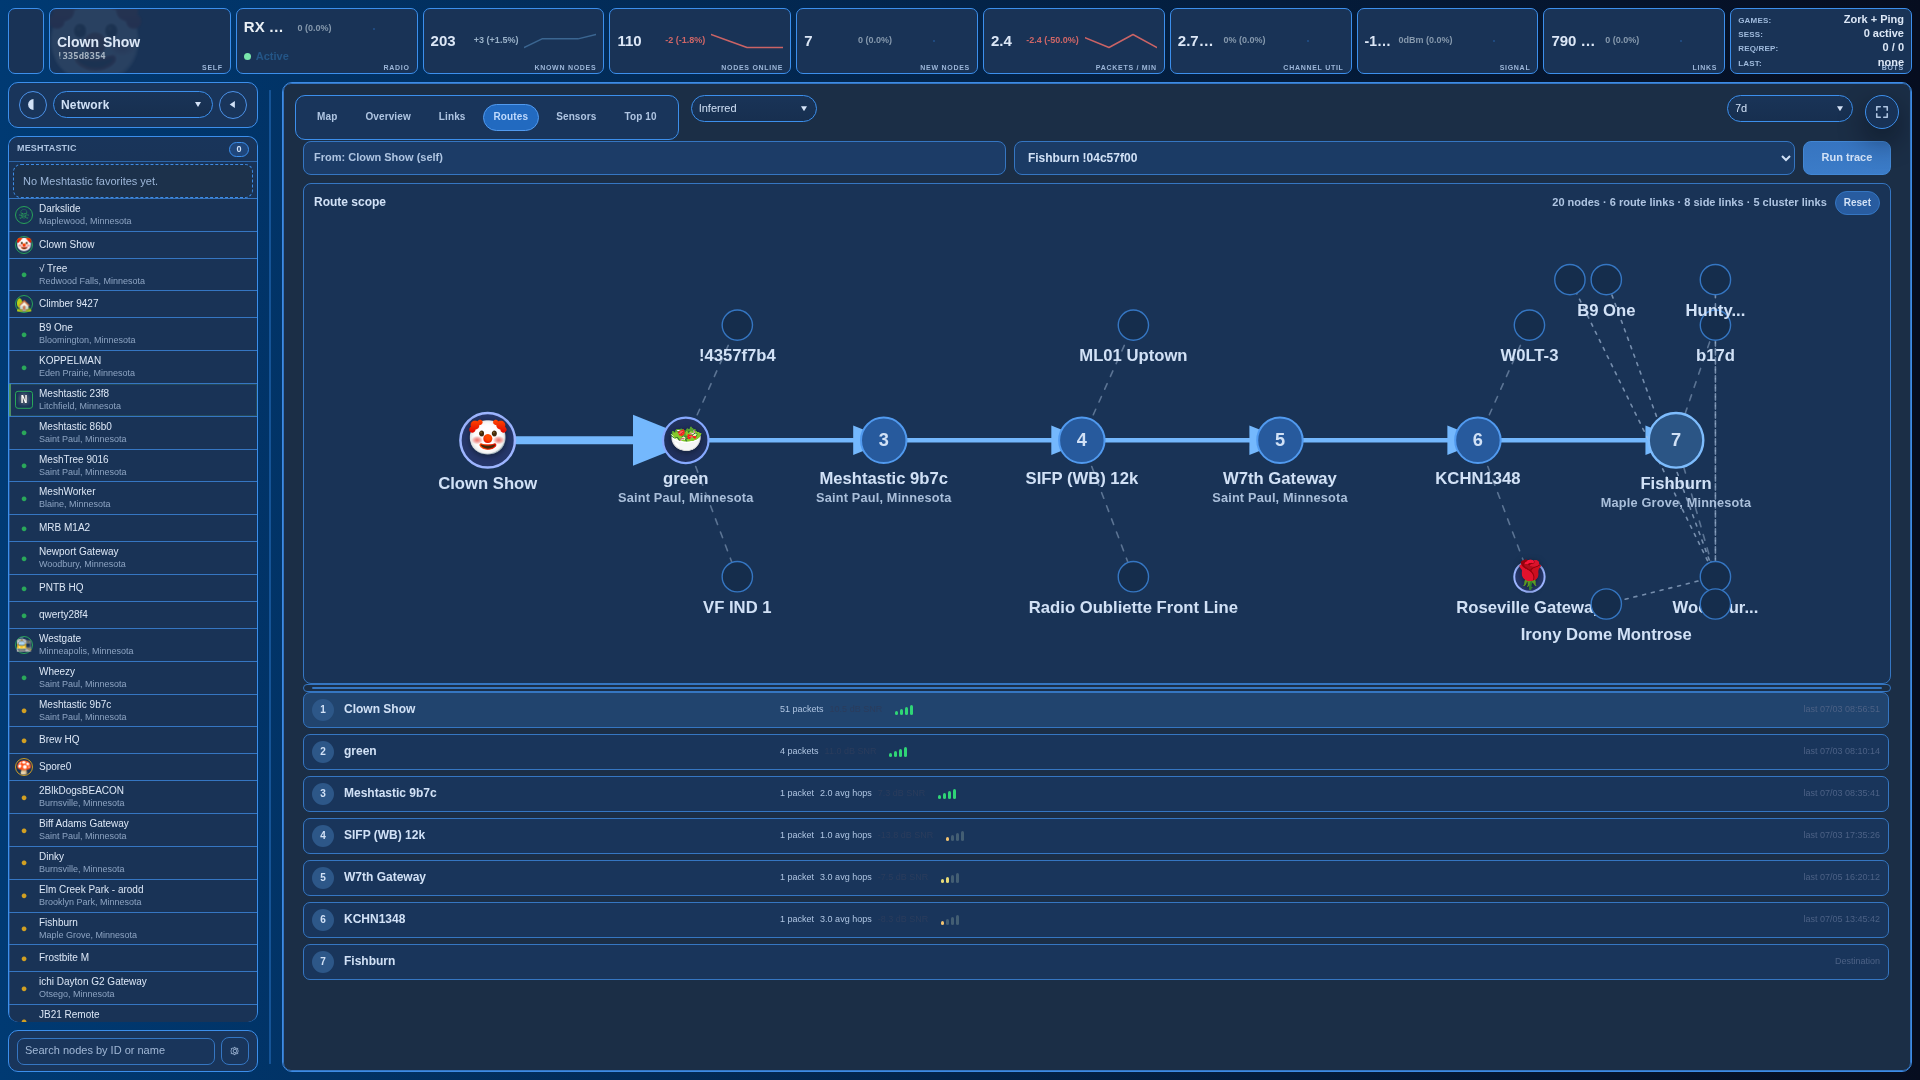
Trace view for a source, destination, nearby links, and per-hop packet details.
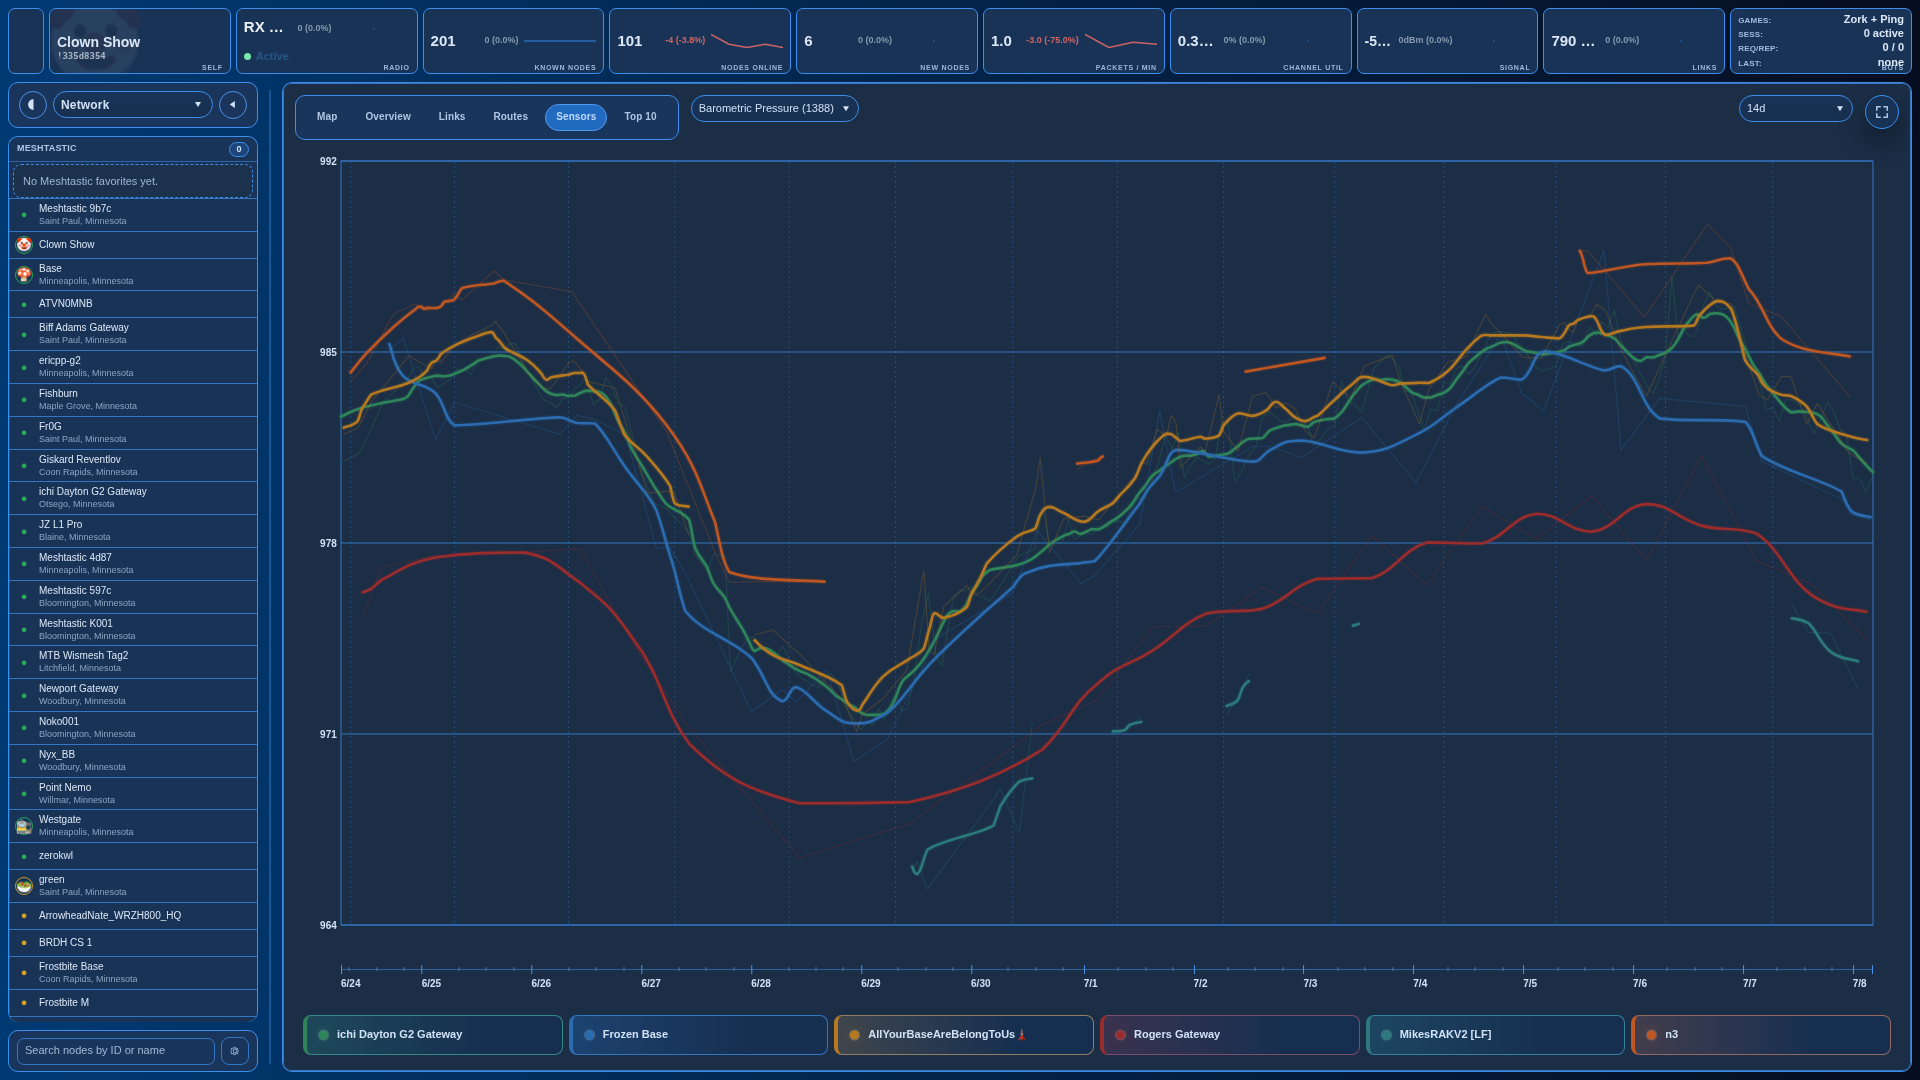
Telemetry chart comparing sensor history across multiple nodes.

Top cards for radio activity, node counts, packets, links, battery, and channel use.
Themes can reshape the full dashboard with custom colors, gradients, transparency, blur, fonts, particles, or a live-map background. These example palettes are custom themes; select any preview to open its full-resolution screenshot.
| Signal Green | Neon Magenta | Aurora Relay |
|---|---|---|
 |  |  |
Meshyface nodes can share compact appearance packets containing a node-theme
recipe and an optional ghost or watermark. Configure and preview your node in
Settings > Appearance > Node Appearance, enable Share node appearance,
then use Broadcast appearance to publish it.
flowchart LR
  Browser["Browser<br/>single-page UI"]
  CDN["Vendored browser assets<br/>Leaflet + leaflet.heat + particles.js"]
  Tiles["Basemap provider<br/>OpenStreetMap tile service"]
  Server["ThreadingHTTPServer<br/>HTML shell + JSON API"]
  Assets["Python template assembly<br/>meshdash/html* + meshdash/assets/*"]
  State["State loaders<br/>live snapshot + history readers"]
  Services["Write services<br/>chat, settings, tools, games, optional files"]
  Tracker["DashboardTracker<br/>live receive path + in-memory buffers"]
  History["HistoryStore / SQLite (WAL)<br/>chat, packets, rollups, settings"]
  Radio["Meshtastic interface<br/>serial or TCP"]
  Mesh["Meshtastic radio / mesh"]
  Atlas["Bundled offline atlas<br/>reference basemap fallback"]

  Browser -->|GET /| Server
  Browser -->|GET /api/*| Server
  Browser -->|POST write APIs| Server
  Browser --> CDN
  Browser --> Tiles
  Browser -->|fallback basemap data| Atlas
  Server --> Assets
  Server --> State
  Server --> Services
  State <--> Tracker
  State <--> History
  Services <--> History
  Services <--> Radio
  Radio <--> Mesh
  Radio -->|receive callbacks| Tracker
Start with prerequisites and dependencies, then choose one install path:
/opt/meshyface for a persistent GitHub-updatable host./data mounted for persistent state.