
 iamthefrogy/frogy2.0
Orbis is an full spectrum automated external attack surface intelligent toolkit.




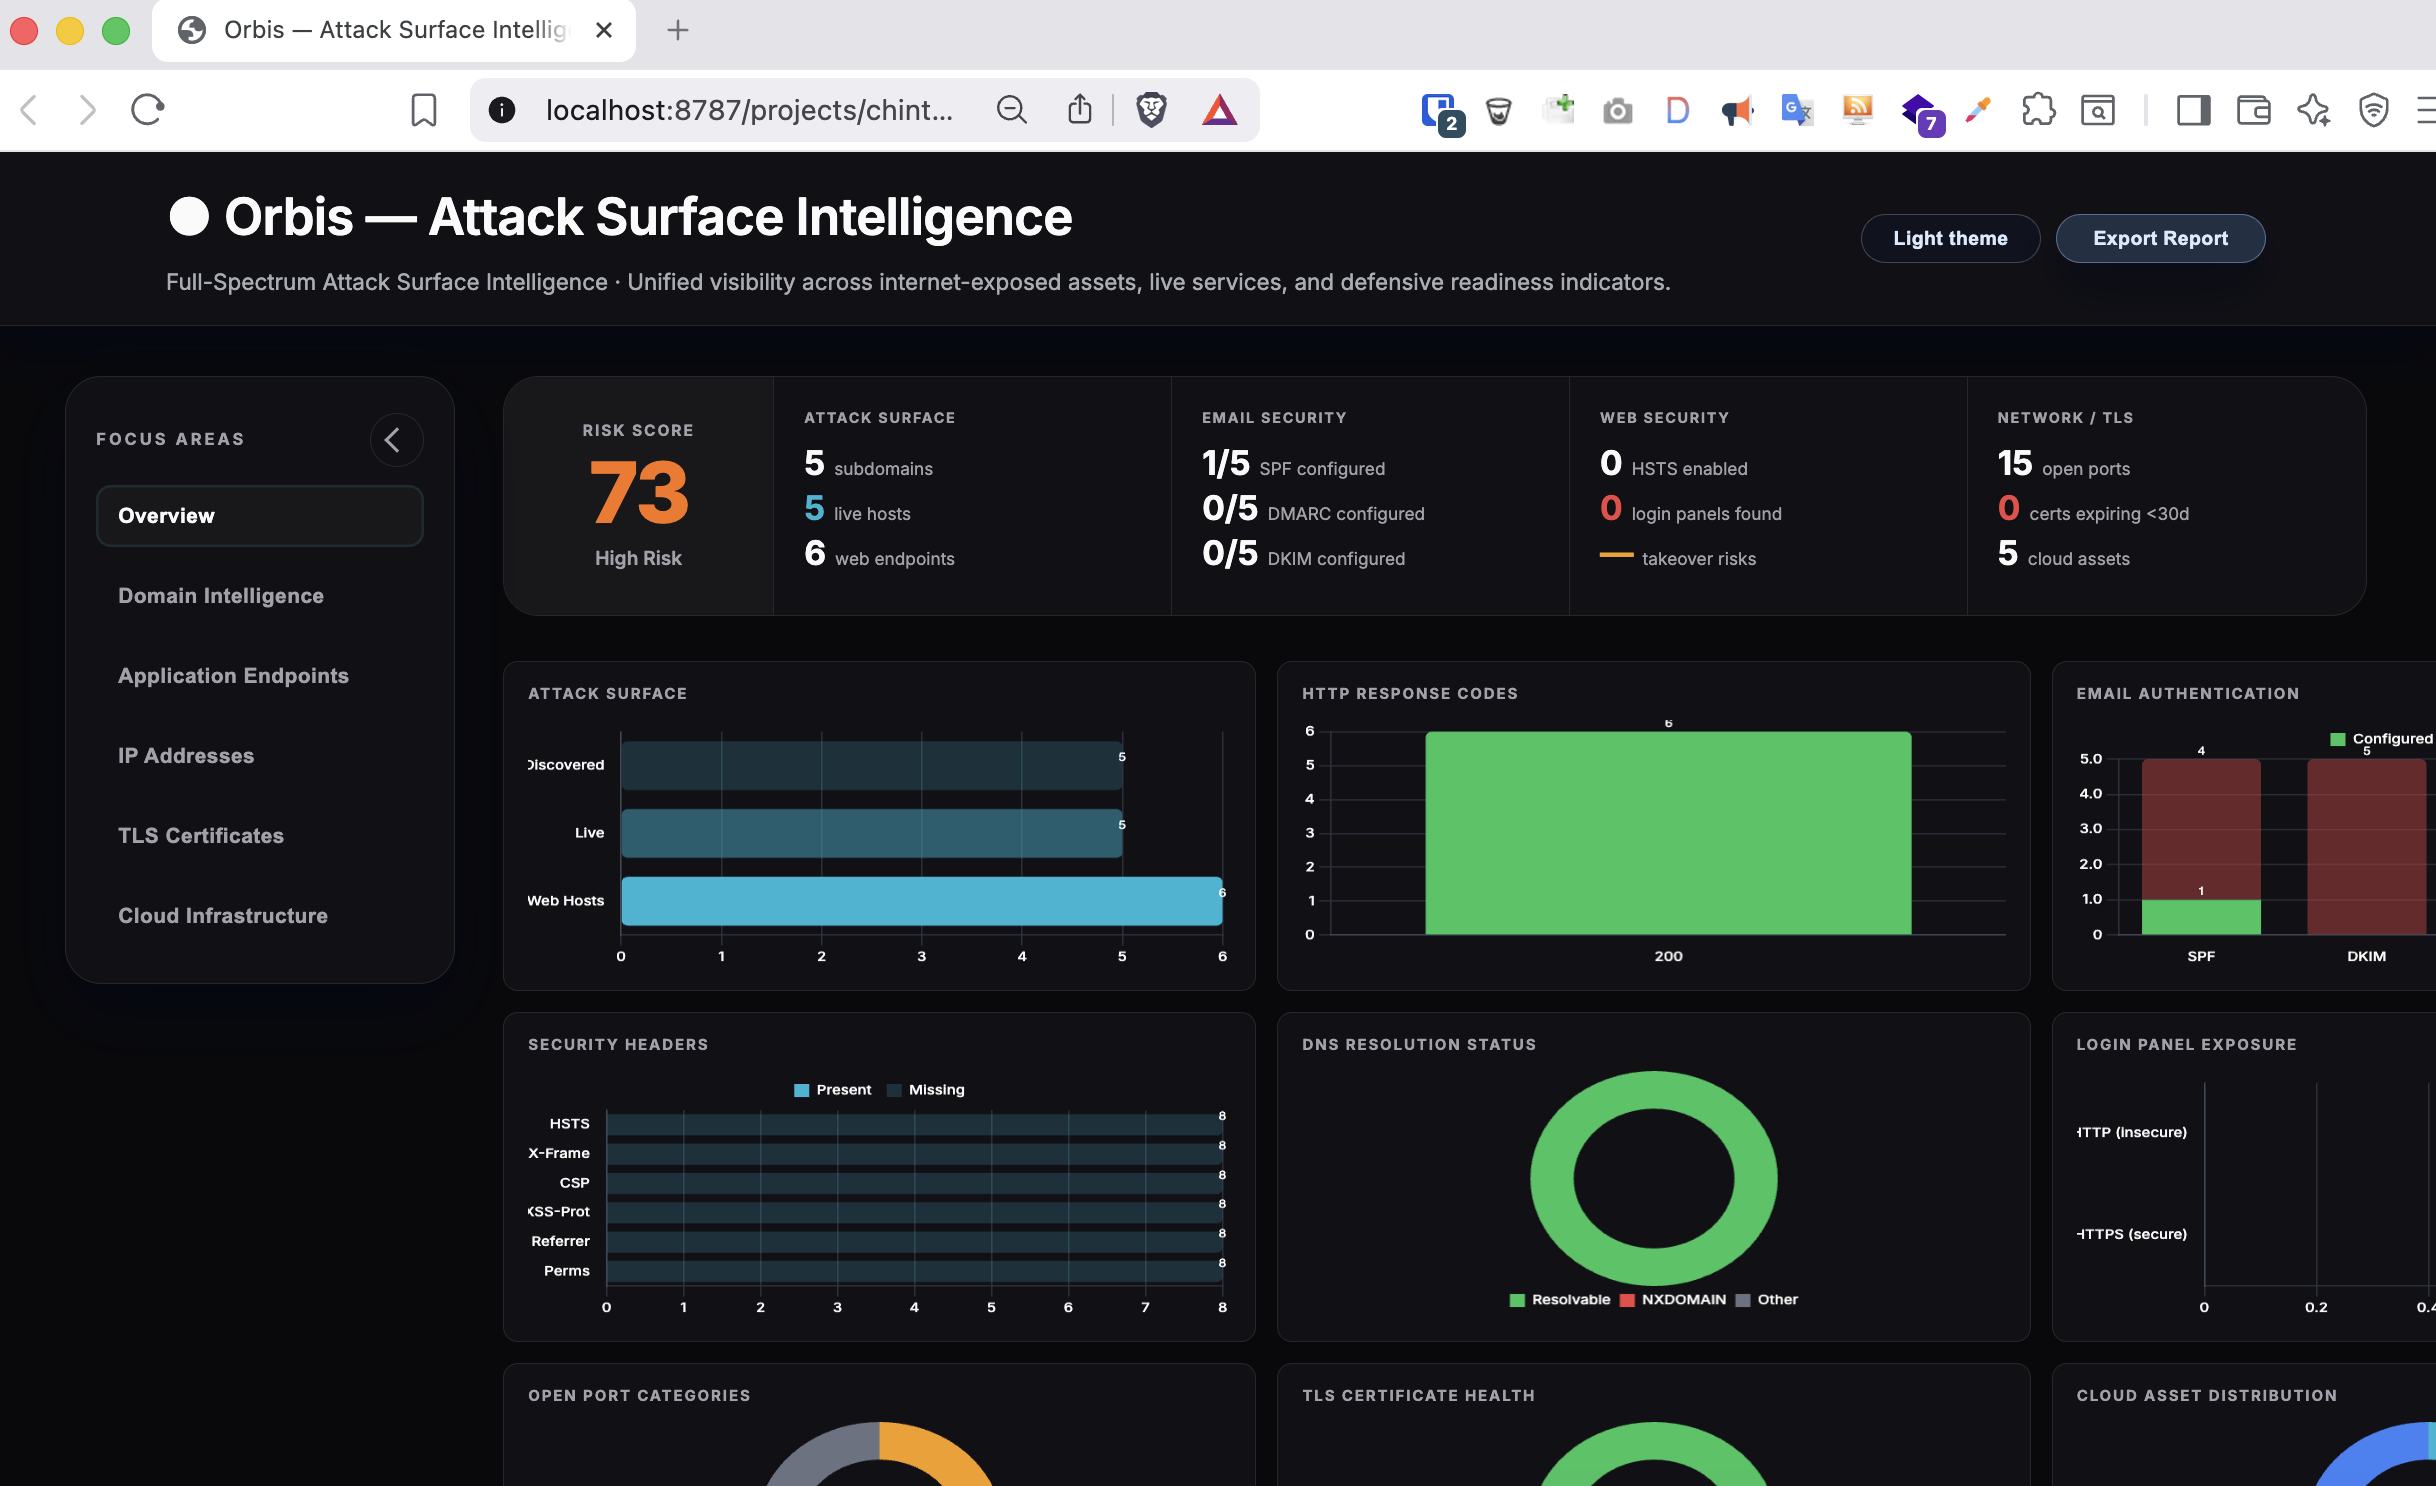
Orbis automatically maps your organisation's entire internet-facing attack surface, subdomains, open ports, web applications, cloud infrastructure, TLS certificates, email posture, exposed secrets, login panels, and more, then scores and ranks every discovered asset so you know exactly where to focus first.
You give it a list of domains. It does the rest.
You give it a list of domains. It does the rest.
google.com          →   Frogy 2.0 discovers:
apple.com                  • 2,000+ subdomains (passive + active enumeration)
example.com                • Every open port across all live hosts
                           • Every web application — status, tech stack, redirects
                           • Login panels, exposed .env files, leaked JS secrets
                           • TLS certificates, cipher strengths, expiry dates
                           • Subdomain takeover candidates (55+ service fingerprints)
                           • Cloud asset inventory (AWS / Azure / GCP / Cloudflare)
                           • SPF / DKIM / DMARC / DNSSEC / BIMI / MTA-STS / DANE
                           • Third-party vendor dependencies across all surfaces
                           • Interactive asset relationship graph
                           → Risk-scored, prioritised, searchable HTML report
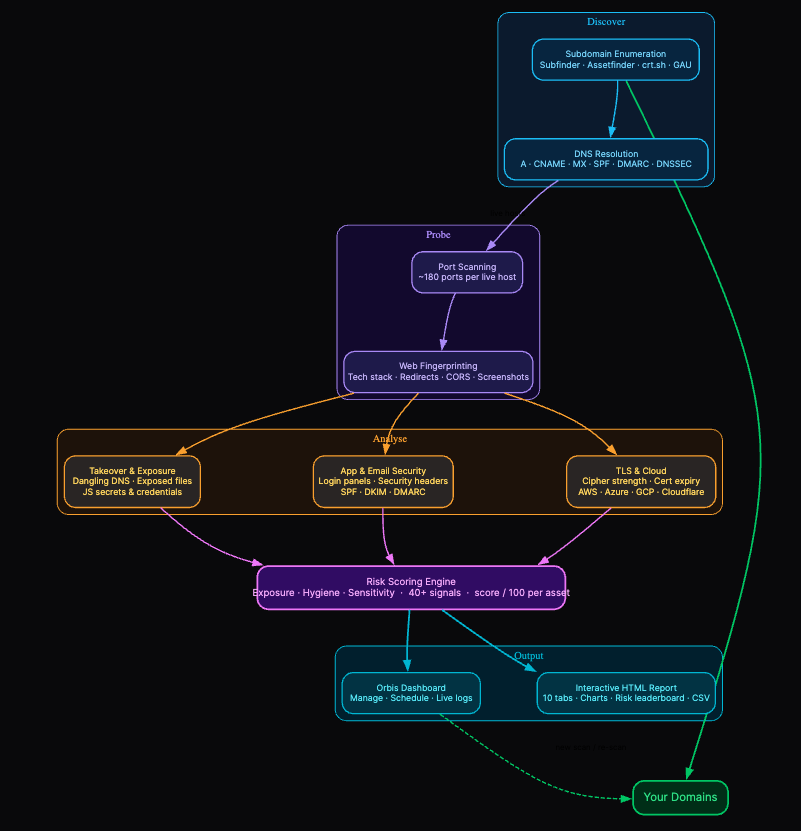
Frogy 2.0 runs a 31-step bash pipeline against your targets — fully automated from discovery to report, all stages run unconditionally.
| Phase | Steps | What happens |
|---|
| Seed Expansion | 1–3 | crt.sh org filter · ARIN RDAP ASN→CIDR · TLD sweep · brand variation · SEC EDGAR · WhoisXML registrant pivot (API-optional) |
| Discovery | 4–9 | Subfinder + Assetfinder + crt.sh + GAU + Wayback CDX + RapidDNS + OTX/VT (API-optional) → merge + exclusion filter |
| DNS & Takeover | 10–11 | DNSX full resolution (A/AAAA/CNAME/MX/NS/SPF/DMARC/DKIM/DNSSEC/BIMI/MTA-STS/DANE) · CDN/cloud tier classify · 55+ dangling-DNS fingerprints |
| Port + Web | 12–16 | IPv6 discovery · Naabu port scan (~500 ports, CDN-aware) · web-port URL expansion · HTTPX fingerprinting · Shodan banner enrichment (API-optional) |
| Crawl + JS | 18–19 | Katana deep crawl (JS-aware, depth 3) → JS file analysis (secrets, endpoints, SDK refs) |
| Security Analysis | 21–23 | Login panel detection · TLS/cipher grading · security header compliance · CORS / BIMI / MTA-STS / DANE / WHOIS structured fields |
| Intelligence | 24–29 | SaaS tenants · third-party vendor intel (100+ patterns) · API surface · colleague identification · GitHub org surface · favicon hash clustering |
| Cloud | 30 | Cloud infra inventory + WAF shielding status · open storage check · bucket permutation |
| Score + Report | 31 | Three-bucket risk scoring (70+ signals) → self-contained HTML report with 11 tabs |
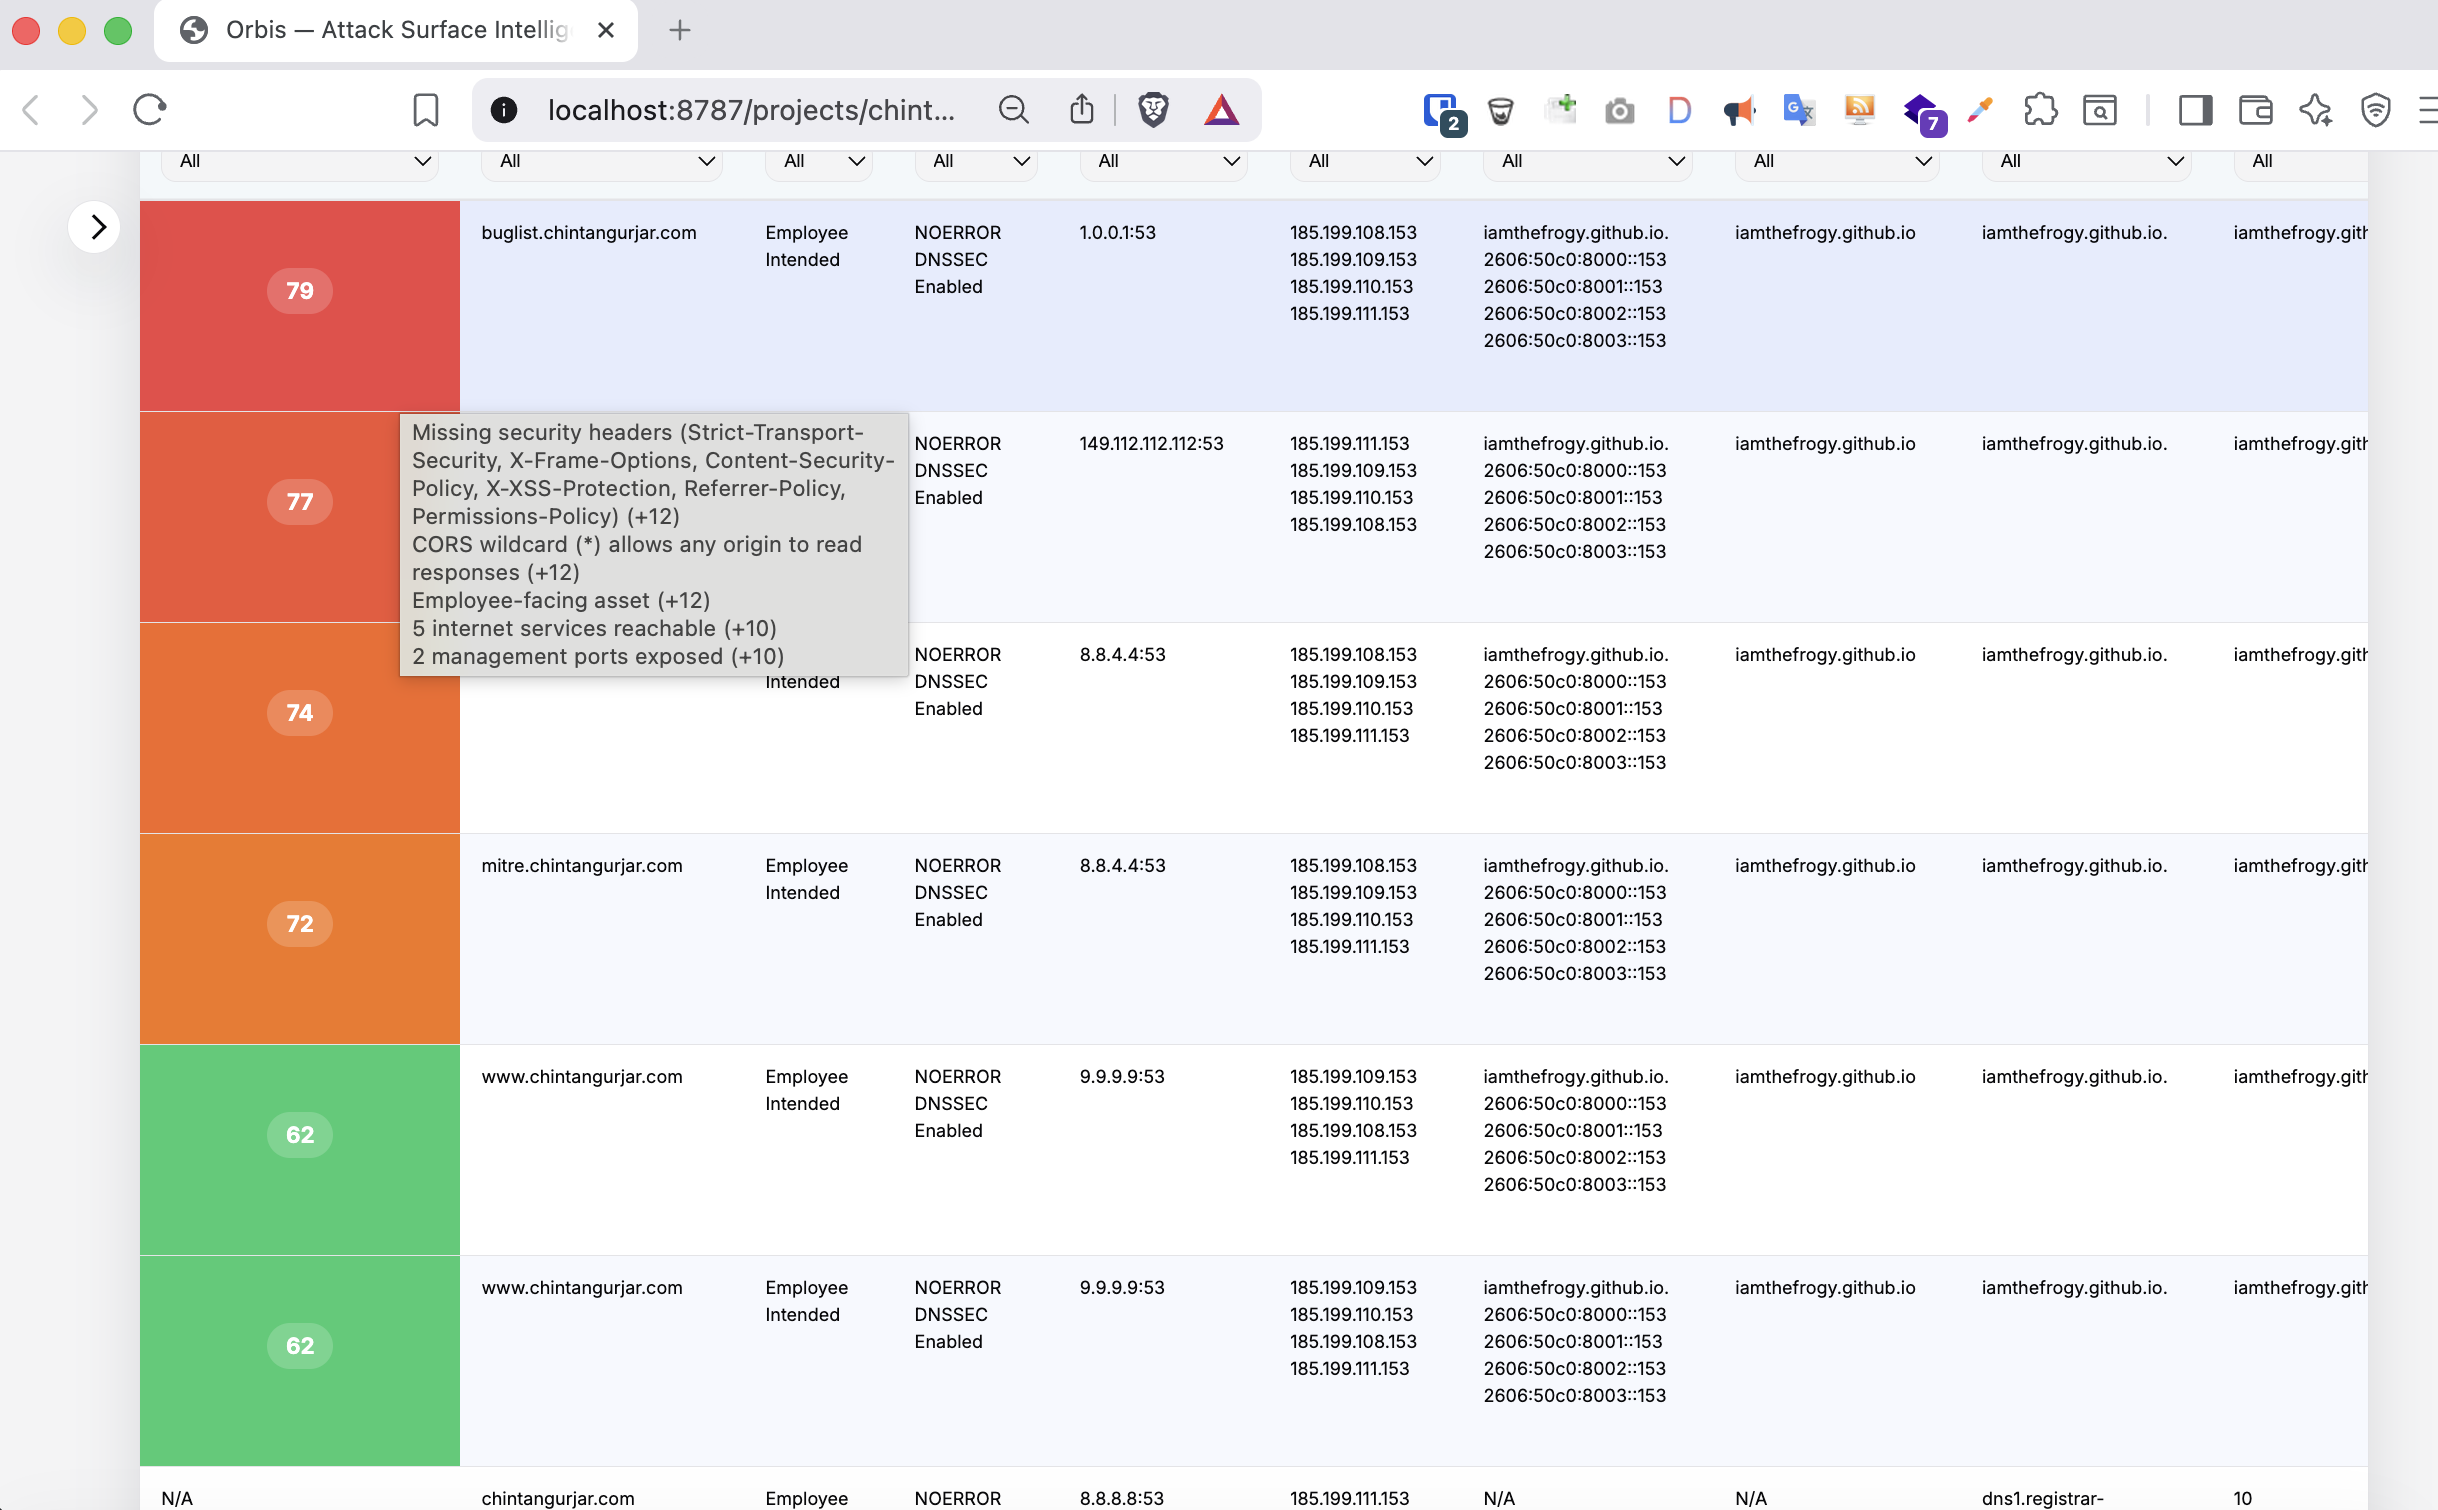
-follow-redirects captures final-hop metadata (not the redirect page)/users/123 → /users/{id}), query strings stripped? chip on any column header for a one-sentence definition and attacker use caseEvery endpoint is scored through three capped buckets (max 100). The aggregate report score is the mean of the top-5 domain endpoint scores.
| Bucket | Cap | Measures |
|---|---|---|
| Sensitivity | 40 | Asset criticality, stack complexity, data-handling classification |
| Exposure | 35 | Directly dangerous or reachable attack surfaces |
| Hygiene | 25 | Misconfigurations, certificate health, compliance gaps |
| Signal | Points |
|---|---|
| Employee-facing / internal asset | +12 |
| Admin / monitoring tool in stack (Kibana, Grafana, Jenkins, phpMyAdmin, k8s Dashboard) | +12 |
| Crawl surface size — unique deduplicated pages (log-scaled) | up to +12 |
| Identity / auth service (Keycloak, Okta, Auth0, LDAP, SAML) | +8 |
| Object storage endpoint exposed | +8 |
| Error / debug page publicly visible | +8 |
| Non-production environment in title (dev / staging / test / UAT) | +6 |
| API surface detected | +6 |
| CMS admin surface (WordPress, Drupal, Magento) | +6 |
| Managed database footprint reachable | +7 |
| Business-critical TLD / financial-themed path in crawl | up to +8 |
| High-risk third-party vendor in use | up to +6 |
| Cloud API / serverless resource | +5 |
| SaaS tenant footprint detected | +3 |
| Cloud managed surface | +3 |
| Full-stack framework detected | +2 |
| Authentication-protected surface (HTTP 401) | +3 |
| Signal | Points |
|---|---|
| Open / publicly accessible cloud storage bucket | +20 |
| Login interface served over HTTP | +20 |
| Authenticated surface (HTTPS login) | +12 |
| High-value login panel (phpMyAdmin, Jenkins, k8s, Portainer, Grafana, remote-access) | +8 – +10 bonus |
| Confirmed subdomain takeover | +15 – +20 |
| Potential subdomain takeover (dangling CNAME) | +8 – +12 |
| Admin tool visible in page title (Kibana, Grafana, Jenkins…) | +10 |
Directory listing enabled (Index of /) | +10 |
| Management port(s) exposed | up to +15 |
| Database port(s) exposed | up to +12 |
| Open internet services (port count) | up to +14 |
| Unique crawlable pages (log-scaled) | up to +12 |
| Cloud workload / CDN without WAF shielding | +8 – +12 |
| Infrastructure management interface in tech stack | +6 |
| TLS handshake failure | +6 |
| HTTP 403 (resource exists, blocked by auth) | +4 |
| 5xx server error | +4 |
| Signal | Points |
|---|---|
| TLS certificate expired | +20 |
| Deprecated SSL 3.0 protocol | +18 |
| NULL / anonymous cipher suite | +18 |
| RC4 / DES / 3DES broken cipher | +12 |
| Legacy TLS 1.0 / 1.1 | +12 |
CORS wildcard * | +12 |
| CORS null-origin allowed | +10 |
| End-of-life server (Apache 2.x / nginx ≤1.17 / PHP 5–7) | +10 |
| Certificate expires within 7 days | +12 |
| Self-signed certificate | +8 |
| Error / debug / stack trace page public | +8 |
| CBC cipher in use (BEAST / POODLE) | +6 |
| Development server exposed (Werkzeug, Flask dev) | +6 |
| Certificate expires within 30 days | +6 |
| HTTP → HTTPS redirect downgrade detected | +6 |
| Weak RSA key < 2048 bits | +8 |
| Missing security headers (HSTS, CSP, X-Frame-Options…) | up to +12 |
| DMARC not published | +6 |
| SPF not published | +4 |
| Certificate validity unknown | +4 |
| Wildcard TLS certificate | +4 |
| DKIM not published | +3 |
| DNSSEC not enabled | +2 |
| Server version disclosed in headers | +5 |
Why it matters: An internal admin panel with an expired self-signed cert, a wildcard CORS header, and port 3306 exposed scores far higher than a static marketing page — so your team skips the noise and starts where it matters.
git clone https://github.com/iamthefrogy/frogy2.0.git
cd frogy2.0
chmod 777 *
docker build -t frogy:latest .
Linux (native Docker — --network host works):
docker run --rm --network host --privileged --cap-add=NET_RAW \
  -v "$(pwd)/output:/opt/frogy/output" \
  frogy:latest
macOS / Windows (Docker Desktop — no --network host):
docker run --rm --privileged --cap-add=NET_RAW \
  -p 8787:8787 \
  -v "$(pwd)/output:/opt/frogy/output" \
  frogy:latest
-v "$(pwd)/output:/opt/frogy/output"persists scan history across container restarts.
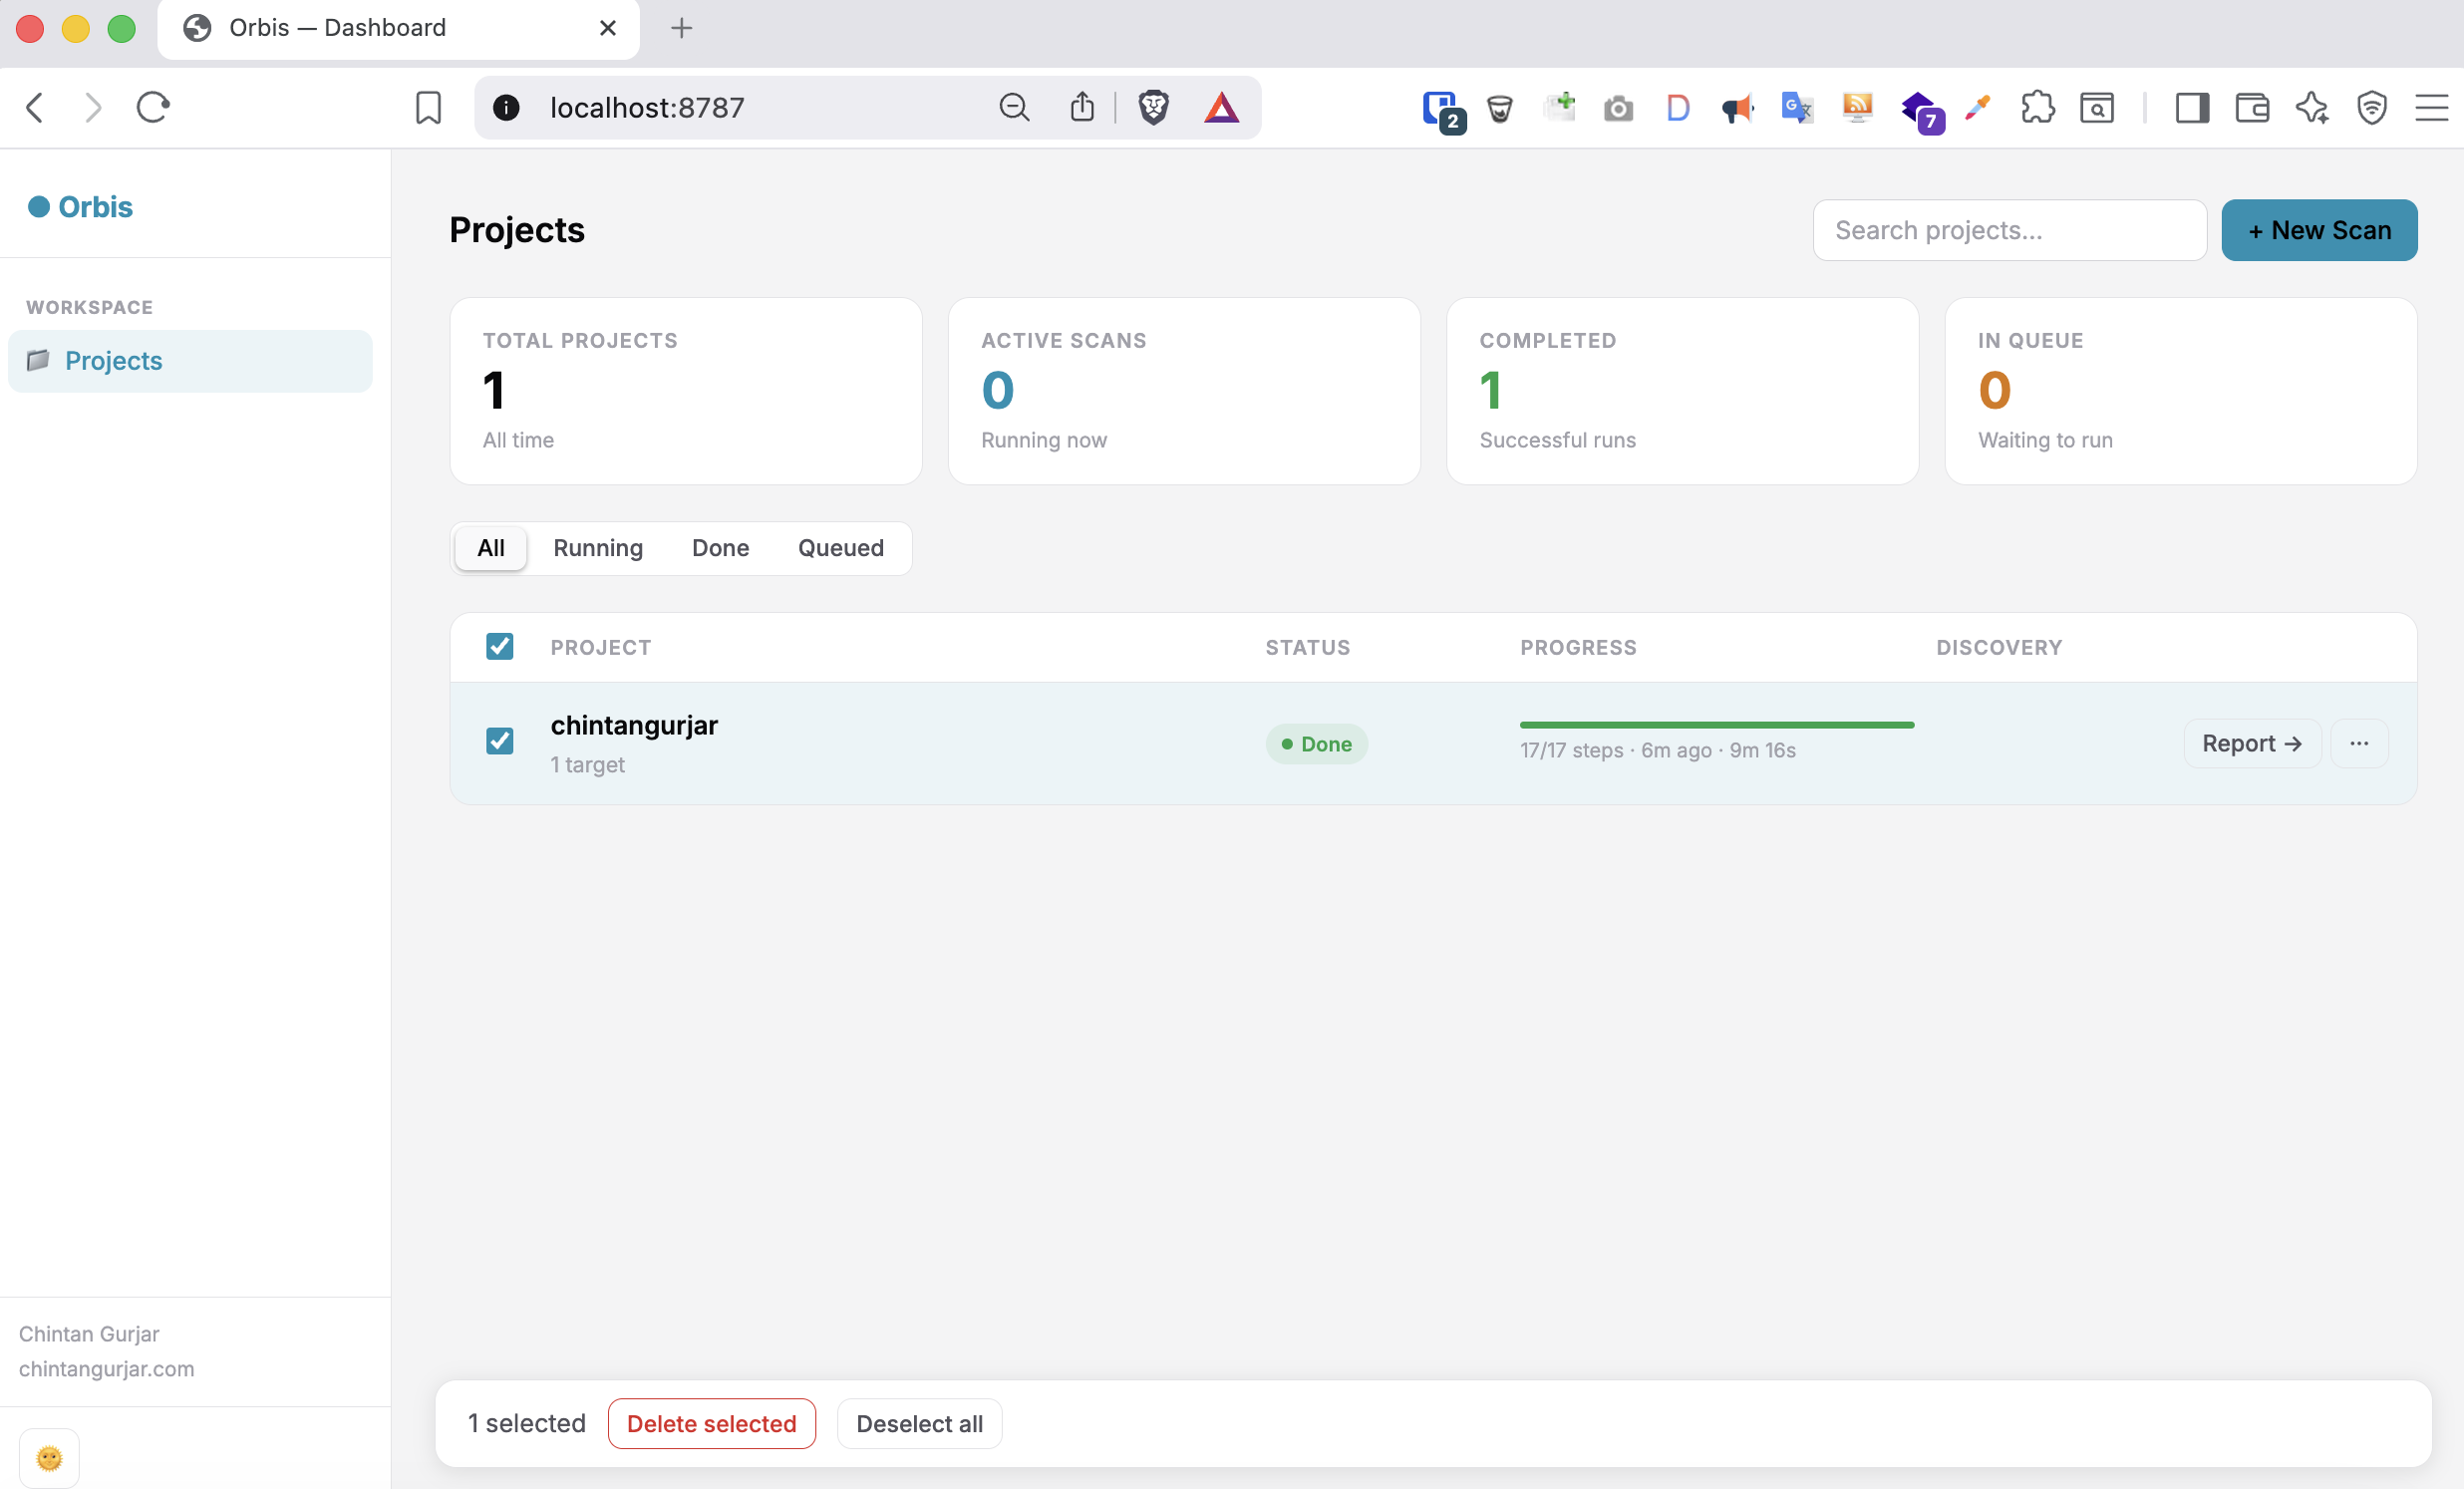
http://localhost:8787
Step X of 31, elapsed timer, real-time log streamingResults are written to output/run-<timestamp>/.
The generated report is a self-contained HTML file — no server needed, open it in any browser.
| Tab | Contents |
|---|---|
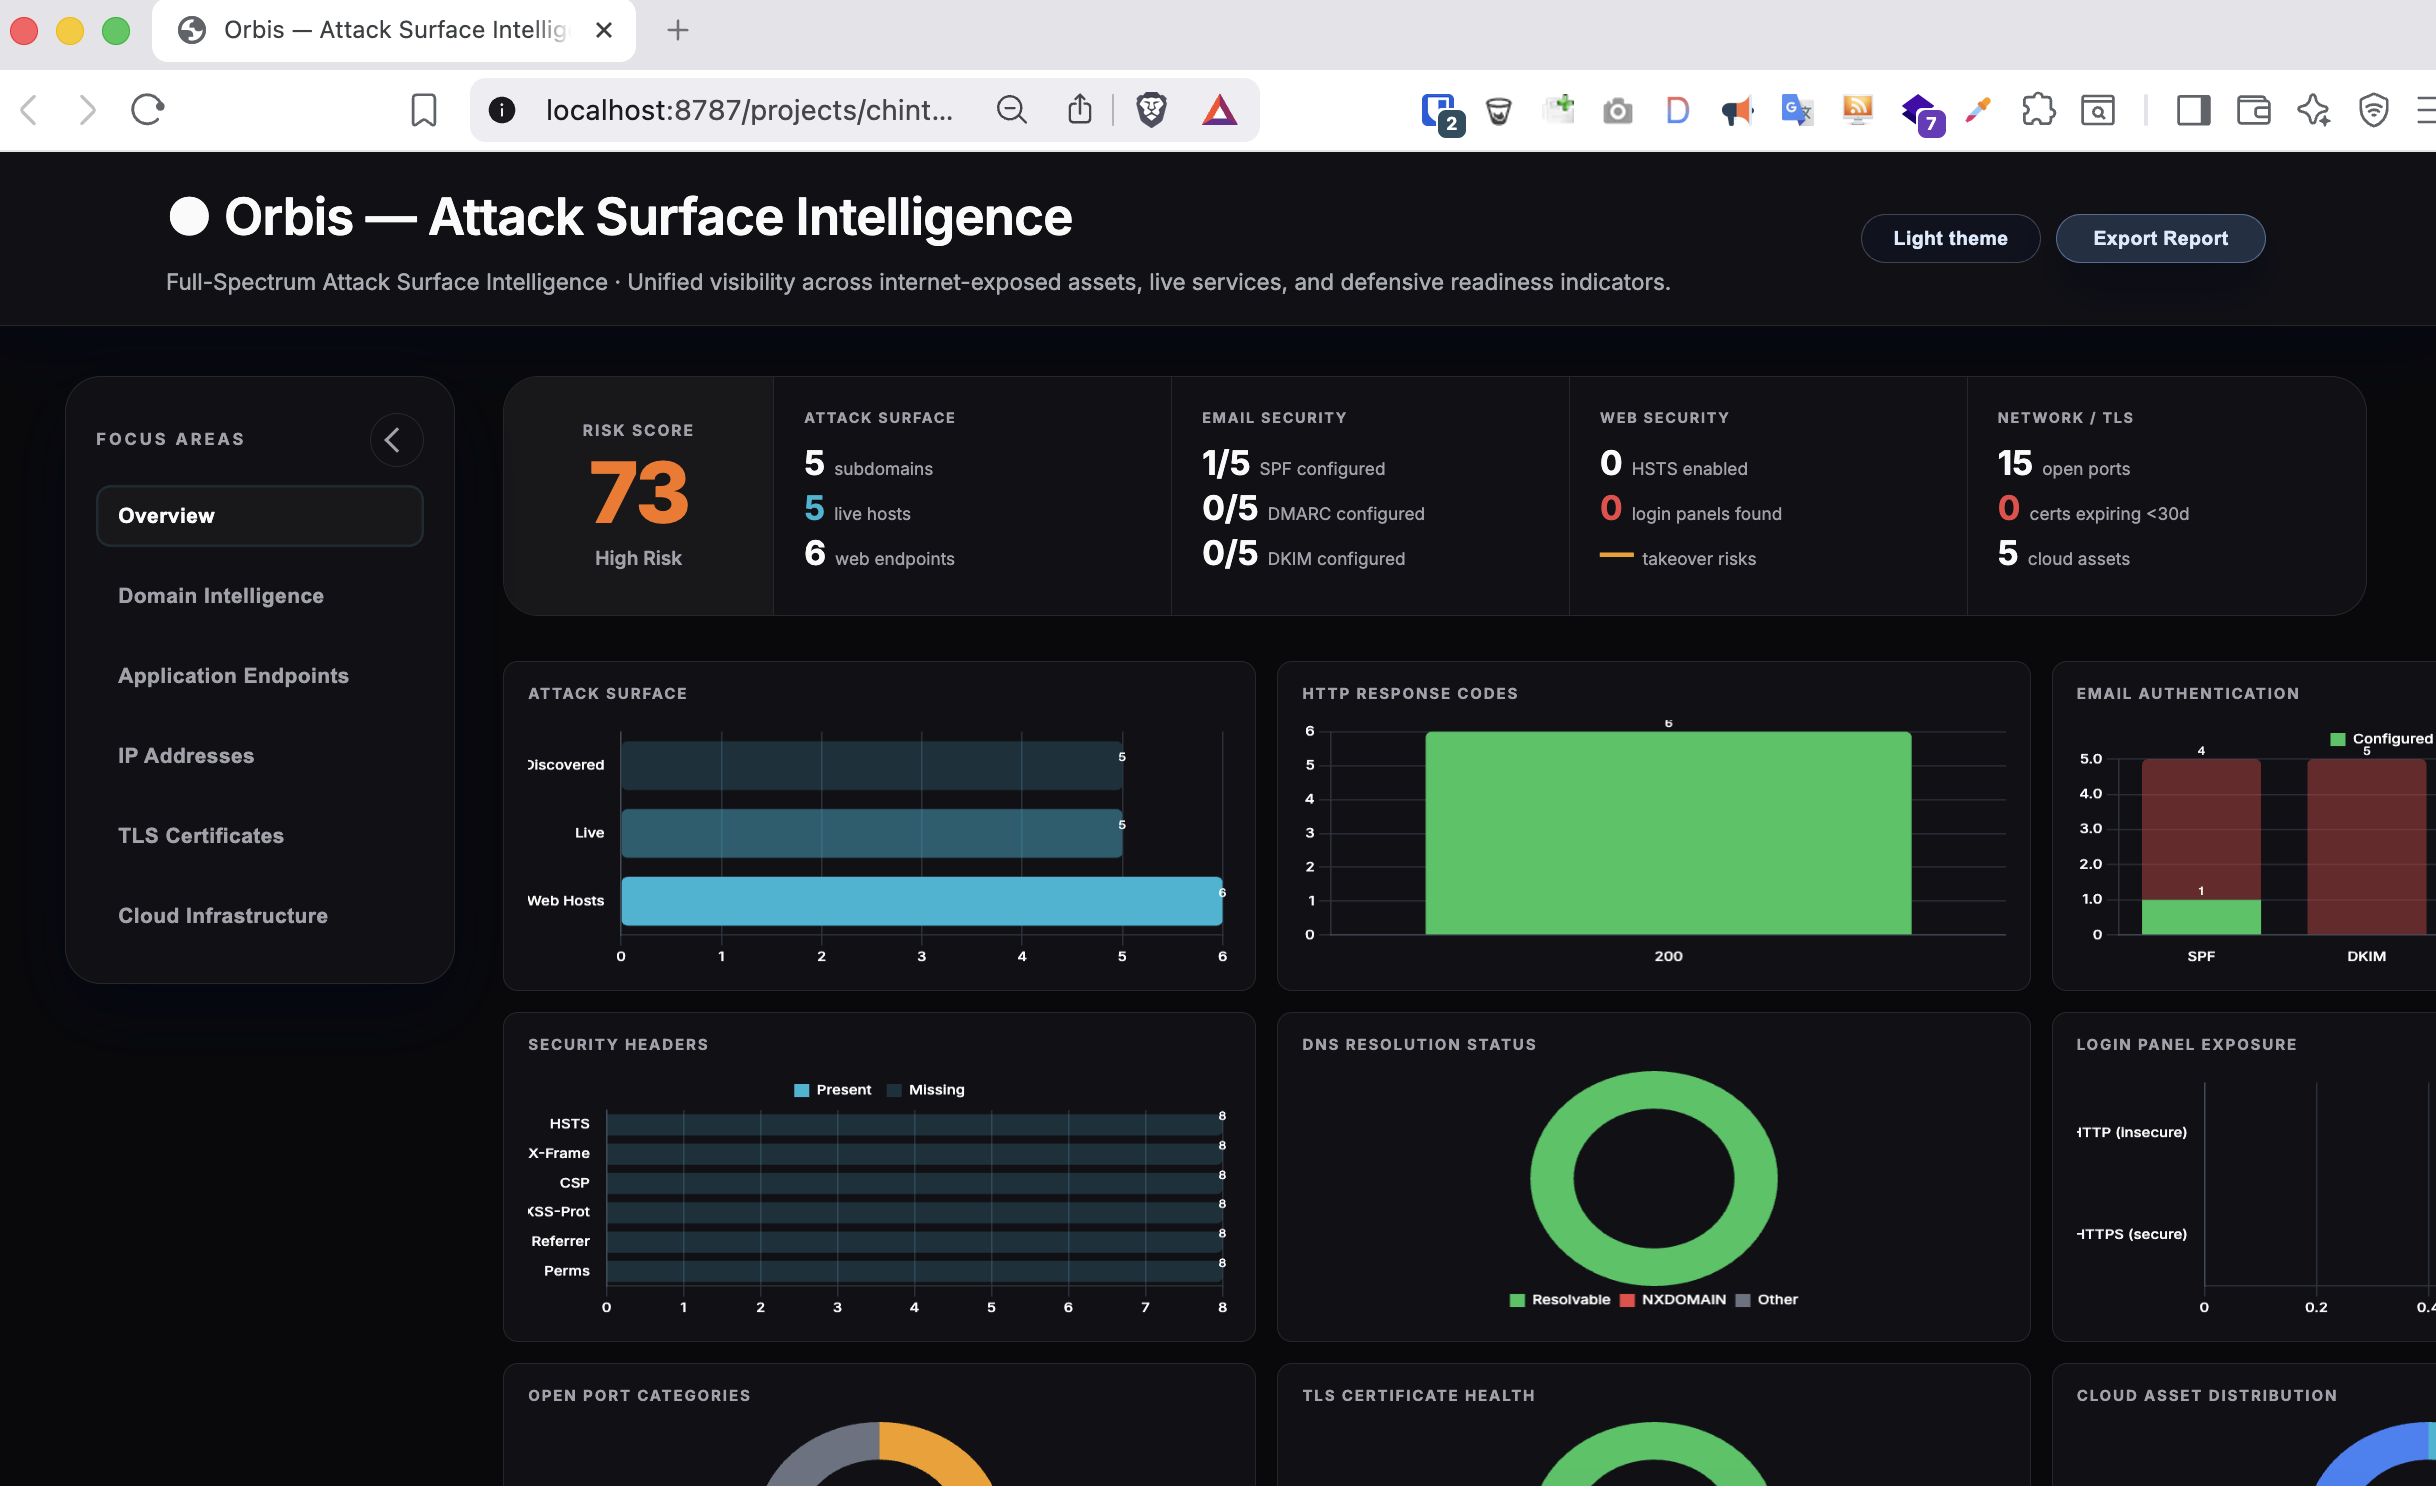
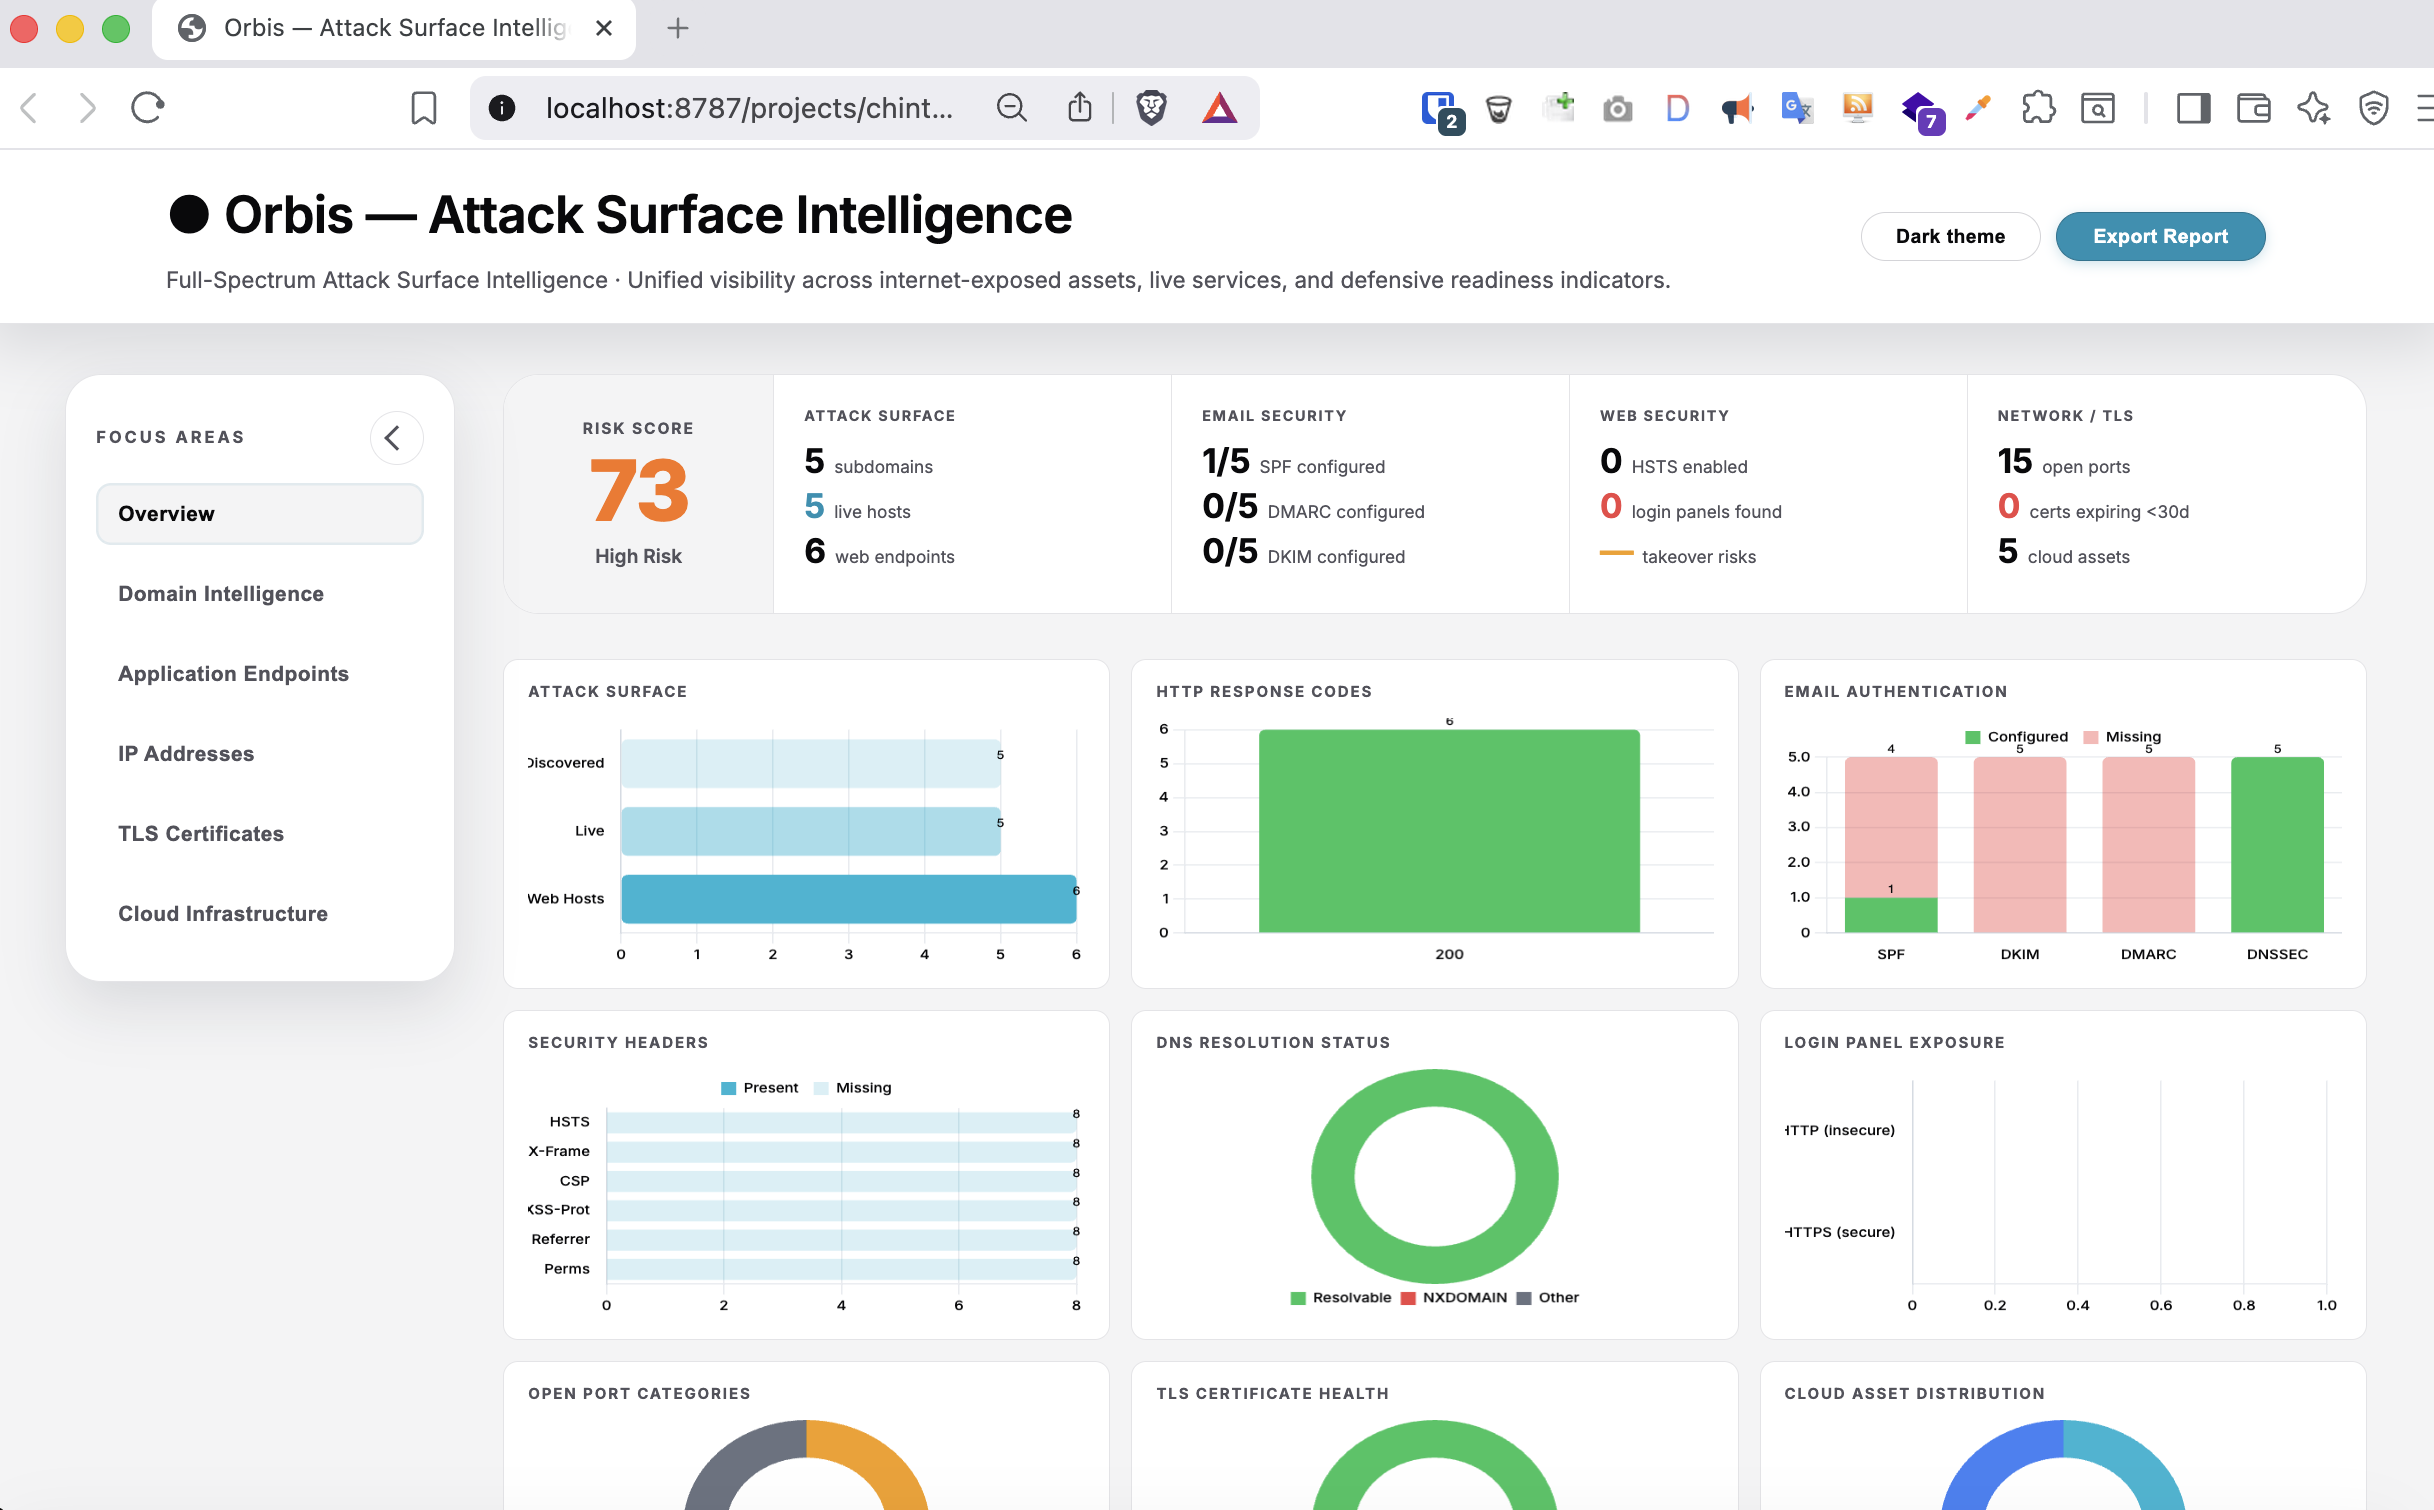
| Overview | Executive banner (Asset Tiers + 5 metric groups) · 9-chart analytics grid · risk leaderboard with clickable Attack Surface Score |
| Domain Intelligence | All subdomains · DNS records · NS cluster badge · Registrar · Domain Age · BIMI/MTA-STS/DANE badges · WHOIS structured fields |
| Application Endpoints | Every live endpoint — status, title, tech stack, login detection, security headers, CORS, CDN |
| IP Addresses | Reverse DNS · ASN · network blocks · geolocation · Shodan service banners (port/protocol/service/version pills) |
| Mail Infrastructure | Per-domain: MX routing · auto-detected mail provider · SPF/DKIM/DMARC/BIMI/MTA-STS/DANE badges · Email Risk Score 0–100 |
| TLS Certificates | Cipher · protocol version · expiry (colour-coded) · SANs · issuer · Cert Score A–F · Key Algorithm · Key Size · Wildcard flag · Self-Signed flag · CA Type |
| Cloud Infrastructure | Asset map by provider · resource type · shielding status |
| Internet Footprint | CIDR blocks · crt.sh org subdomains · TLD sweep results · WHOIS registrant pivot candidates |
| SaaS Tenants | SaaS tenant footprint · open/accessible cloud storage buckets |
| Third Parties | Vendor classification from CSP, JS refs, MX/SPF/CNAME, and response headers · 100+ vendor patterns |
| Asset Topology | Interactive D3 force-directed graph · 8 node types · 11 edge types · ego-network click · search · type filters |
Every table has full-text search, column visibility toggle (hidden columns persisted per browser), and the ⓘ About button explains what each section means and what to look for.
The web UI at localhost:8787 is branded Orbis — Full-Spectrum Attack Surface Intelligence.
Step X of 31), elapsed/total duration··· context menufrogyTheme localStorage key (shared with reports)| Component | Technology |
|---|---|
| Web dashboard | Python · Flask 3.x |
| Scanner pipeline | Bash 5.x · 22-step workflow |
| Subdomain discovery | Subfinder · Assetfinder · crt.sh · GAU |
| DNS resolution | DNSX |
| Port scanning | Naabu |
| Web fingerprinting | HTTPX |
| Web crawling | Katana |
| TLS analysis | tlsx |
| System utilities | jq · curl · whois · dnsutils · openssl |
| Container base | Ubuntu 24.04 · Go 1.24 (tool compilation) |
Access the API Keys panel from the sidebar (🔑 API Keys) to configure:
| Key | Unlocks |
|---|---|
github_token | GitHub org surface discovery, secret detection |
shodan_api_key | Shodan banner enrichment (non-HTTP ports) + favicon hash clustering (MMH3) |
censys_api_key | Censys favicon hash clustering (MD5) — single key, new platform format |
otx_api_key | AlienVault OTX enhanced passive DNS |
virustotal_api_key | VirusTotal passive subdomain feed |
whoisxml_api_key | WHOIS registrant pivot for seed expansion / org ASN mapping |
chaos_api_key | ProjectDiscovery PDCP — runs chaos CLI per domain for live subdomain results |
All keys are optional — the pipeline runs fully without them, skipping only the enrichment steps that require a specific key. Each key has a live validation test and a Clear button in the API Keys panel.
| Component | Technology |
|---|---|
| Web dashboard | Python · Flask 3.x |
| Scanner pipeline | Bash 5.x · 31-step workflow |
| Subdomain discovery | Subfinder · Assetfinder · crt.sh · GAU · Wayback CDX · RapidDNS · OTX · VirusTotal |
| DNS resolution | DNSX (A, AAAA, CNAME, MX, NS, SPF, DMARC, DKIM, DNSSEC, BIMI, MTA-STS, DANE) |
| Port scanning | Naabu (CDN/cloud-tier classification via Team Cymru ASN) |
| Web fingerprinting | HTTPX (follow-redirects, CORS, redirect dedup) |
| Web crawling | Katana (unique-page dedup, numeric segment normalisation) |
| TLS analysis | tlsx (cipher, key algo, key size, wildcard, self-signed, CA type, Cert Score A–F) |
| Banner enrichment | Shodan API · Censys API (both API-optional) |
| Email / DNS intel | dig · BIMI · MTA-STS · DANE/TLSA · structured WHOIS fields |
| Report visualisation | Chart.js (9 charts) · D3 v7 (Asset Topology force graph) |
| System utilities | jq · curl · whois · dnsutils · openssl |
| Container base | Ubuntu 24.04 · Go 1.24 (tool compilation) |
Frogy was presented at BlackHat Arsenal. Watch the full demo:
Special thanks to the Project Discovery team for building the open-source tools that power this pipeline (Subfinder, DNSX, Naabu, HTTPX, Katana, tlsx), and to tomnomnom for Assetfinder. Keep rocking the community!
Built by Chintan Gurjar


