
Skip to content
KitploitKITPLOIT
ToolsBlog
Submit
ToolsBlog
Submit

Hacking, PenTest, and Cybersecurity Tools for Your Security Arsenal!

Kitploit is a directory of hacking, cybersecurity, and pentesting tools. Discover the latest project updates to find vulnerabilities, analyze systems, automate testing, and strengthen your security.

··Feeds·Contact·Privacy·© 2026 Kitploit

Tool Directory

Categories

View all categories
Loading categories
mora-hwbp — Hardware Breakpoint (DR0-DR7) based patch-less user-mode hooking & telemetry instrumentation engine (AMSI, WLDP & ETW PoC). | Kitploit
Tools/GitHubGitHub/dovughs/mora-hwbp
Defensive ToolsIDS/IPS EvasionDebuggersLearning & EducationRed TeamingAdversarial Attack
GitHubdovughs/mora-hwbp

mora-hwbp

Hardware Breakpoint (DR0-DR7) based patch-less user-mode hooking & telemetry instrumentation engine (AMSI, WLDP & ETW PoC).

View Repository
101 day agoNot yet reviewed

Most Popular

View all →

Discover the most used tools by our community.

Explore all tools

Browse our collection of tools

View all tools →
Share

Mora-HWBP — AMSI / WLDP / ETW Telemetry Hooking via Hardware Breakpoints

A security-research Proof-of-Concept (POC) demonstrating hardware-breakpoint (CPU debug register) based function hooking as an alternative to traditional in-memory code patching.

Purpose & Scope

This repository is published strictly for defensive security research, red-team/purple-team education, detection engineering, and academic study of Windows internals. It demonstrates how an attacker could abuse processor debug registers to neutralize user-mode security telemetry — and, equally important, what defenders should monitor for in order to detect such techniques. The author is not responsible for any misuse of this code. Usage of this technique against systems without explicit authorization is illegal and violates the relevant computer-fraud and abuse laws in most jurisdictions. Do not deploy this in any environment you do not own or have explicit written permission to test.


Table of Contents

  1. Overview
  2. Background — Why Hardware Breakpoints?
  3. Targeted Security Components
  4. Architecture
  5. Technical Deep Dive
    • 5.1 Hardware Breakpoints on x64
    • 5.2 Debug Register Layout (DR0–DR7)
    • 5.3 The Vectored Exception Handler (VEH)
    • 5.4 Per-Component Interception Logic
    • 5.5 Thread Management & Hook Persistence
  6. Exported API
  7. Build Instructions
  8. Injection & Usage Example
  9. Detection & Mitigation (Blue Team)
  10. Known Limitations
  11. References

Overview

mora_hwbp.c implements a DLL that, once loaded/injected into a target process (e.g., a PowerShell host), hooks four user-mode functions exclusively through CPU hardware breakpoints stored in the architectural debug registers (DR0–DR7) of every thread in the process:

A per-process Vectored Exception Handler (VEH) receives the EXCEPTION_SINGLE_STEP (0x80000004) faults raised by the debug registers, simulates the original function's successful return path by rewriting the exception context, and resumes execution — all without modifying a single byte of executable memory.

This makes the technique particularly interesting from both offensive and defensive perspectives:

  • Offensively, it bypasses EDR/HIPS integrity checks that look for modified .text sections (classic inline hooking, EAT/IAT patching, or Etwp* stubbing).
  • Defensively, hardware breakpoints leave highly distinctive forensic artifacts (debug-register contents, single-step exception density, VEH registration, GetThreadContext/SetThreadContext syscall patterns) that can be used for detection.

Background — Why Hardware Breakpoints?

Traditional user-mode hooking approaches — inline detours (5–14 byte overwrites), import address table (IAT) hooking, and export address table (EAT) hooking — share a common weakness: they modify memory that integrity scanners and ETW can observe.

Modern AV/EDR products implement:

  • Memory scanning / AMSI scans of PowerShell and .NET CLR buffers;
  • ETW-based telemetry (Microsoft-Windows-PowerShell, .NET ETW, threat intelligence providers);
  • Kernel callbacks and user-mode integrity checks that detect pageguard/guard-page tricks, VirtualProtect transitions to PAGE_EXECUTE_READWRITE, and section hash mismatches.

Hardware breakpoints sidestep all of this:

  1. They are CPU registers, not memory — there is nothing to scan in .text.
  2. They are set on a per-thread basis via the Windows API SetThreadContext, which does not trigger the classic "memory modified" signals used by integrity scanners.
  3. The interception point is handled entirely by the processor's exception dispatch, which routes through the process VEH chain before any user-mode target function executes.

This POC explores the efficacy and detectability of this technique against AMSI (Antimalware Scan Interface), WLDP (Windows Lockdown Policy), and ETW (Event Tracing for Windows) — the three most widely relied-upon user-mode security primitives in the modern Windows security stack.


Targeted Security Components

AMSI — Antimalware Scan Interface

AMSI is the Windows platform integration point that allows applications (PowerShell, Office, VBScript, .NET hosts, etc.) to request content scanning from registered antimalware providers. Two entry points are of primary interest:

  • AmsiScanBuffer(HANDLE hamsiContext, PVOID buffer, ULONG length, LPCWSTR contentName, HANDLE hamsiSession, AMSI_RESULT *pResult)
  • AmsiScanString(HANDLE hamsiContext, LPCWSTR string, LPCWSTR contentName, HANDLE hamsiSession, AMSI_RESULT *pResult)

By forcing the returned AMSI_RESULT to AMSI_RESULT_CLEAN (0), the script engine believes the content was inspected and found benign, so execution continues uninterrupted.

WLDP — Windows Lockdown Policy

WLDP implements policy evaluation for Windows Defender Application Control (WDAC / Device Guard). WldpIsClassInApprovedList answers whether a given COM class (identified by GUID) is permitted under the current policy. AMSI internally consults WLDP to decide whether certain script/content classes are "trusted" (in the approved list). If the function reports the class as approved, AMSI may skip additional scrutiny for that content type.

The DLL sets the isApproved output parameter (RDX) to TRUE and returns S_OK, making the evaluated class appear trusted.

ETW — Event Tracing for Windows

EtwEventWrite in ntdll.dll is the core user-mode sink for virtually all ETW event emission on the system. Suppressing it has broad side effects relevant to security monitoring:

  • PowerShell pipeline and script-block logging events
  • .NET assembly load events (Microsoft-Windows-DotNETRuntime)
  • AMSI scan-result telemetry
  • Threat-Intelligence provider events consumed by EDR agents

The DLL simply returns ERROR_SUCCESS (0) without executing the real function.


Architecture

root@kitploit:~
┌──────────────────────────────────────────────────────────────────────────┐
│                           Target Process (e.g. powershell.exe)           │
│                                                                          │
│  ┌──────────────────────────┐        ┌──────────────────────────────────┐│
│  │      mora_hwbp.dll       │        │           CPU / Windows          ││
│  │                          │        │                                  ││
│  │  DllMain / InstallHook   │        │   Thread A        Thread B       ││
│  │      │                   │        │   ┌────────┐     ┌────────┐      ││
│  │      ▼                   │        │   │ DR0..3 │     │ DR0..3 │      ││
│  │  Resolve exports         │        │   └────────┘     └────────┘      ││
│  │  (amsi/wldp/ntdll)       │        │                                  ││
│  │      │                   │        │   #DB (single-step)              ││
│  │      ▼                   │        │   exception ──► Windows Dispatch ││
│  │  AddVectoredException    │        │        │                         ││
│  │  Handler(VEH)            │        │        ▼                         ││
│  │      │                   │        │  ┌─────────────────────────────┐ ││
│  │      ▼                   │        │  │  VectoredHandler (ours)     │ ││
│  │  SetHwbpOnThread(ALL)    │        │  │  • match #DB address        │ ││
│  │      │                   │        │  │  • rewrite context (RIP/RSP)│ ││
│  │      ▼                   │        │  │  • spoof return value (RAX) │ ││
│  │  MonitorThread ◄──┐      │        │  │  • continue execution       │ ││
│  │  (re-hook every   │      │        │  └─────────────────────────────┘ ││
│  │   500ms)          └──────┘        │                                  ││
│  └──────────────────────────┘        └──────────────────────────────────┘│
└──────────────────────────────────────────────────────────────────────────┘

High-level flow:

  1. The DLL is loaded into the target process (via any injection technique — see Usage).
  2. On DLL_PROCESS_ATTACH (or via the exported InstallHook), the target exports are resolved with GetProcAddress (optionally forcing module loads via LoadLibraryW).
  3. A Vectored Exception Handler is registered as the first handler in the process (AddVectoredExceptionHandler(1, ...)).
  4. The current thread is hooked immediately, then all existing threads in the process are enumerated via CreateToolhelp32Snapshot(TH32CS_SNAPTHREAD, 0) and hooked.
  5. A monitor thread wakes every 500 ms and re-applies the breakpoints to every thread — including newly created threads — guaranteeing hook persistence even if a thread is spawned after hooking or if breakpoints are cleared externally.
  6. When any hooked function is called on any thread, the CPU raises a #DB single-step exception; Windows dispatches it to the VEH, which simulates a benign return and continues execution.

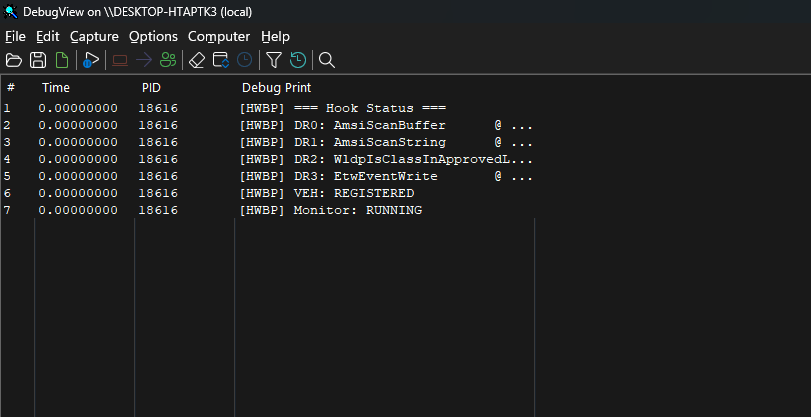
Sample Debug Output

HWBP Engine hook status diagnostics as captured in Sysinternals DebugView

Figure 1 — Sample diagnostics output captured with Sysinternals DebugView. Each line reports the resolved target address and the live hit counter for its corresponding debug register.


Technical Deep Dive

5.1 Hardware Breakpoints on x64

On x86/x64, each CPU provides four hardware debug-address registers (DR0–DR3) and a control register (DR7). Any thread executing with a non-zero breakpoint in DR0–DR3 will fault whenever the instruction pointer reaches that address (or data access matches the configured conditions). The status register DR6 records which breakpoint fired.

Hardware breakpoints are context-sensitive: they are stored in the thread's CONTEXT structure and apply only to the thread on which they are set. This is why a robust implementation must set breakpoints on every thread of the process (and continuously re-apply them for new threads).

5.2 Debug Register Layout (DR0–DR7)

DR7 is a bitfield controlling breakpoint enablement and behavior:

All four breakpoints are configured for execute (instruction-fetch) on a single byte, which is the appropriate condition for function-entry hooks.

5.3 The Vectored Exception Handler (VEH)

When a breakpoint triggers, the processor raises a #DB exception. On x64 Windows the ntdll dispatch routine routes it through the process-wide VEH chain before the thread's Structured Exception Handler (SEH) chain. The handler in this project:

  1. Filters — only handles EXCEPTION_SINGLE_STEP (0x80000004); everything else falls through to EXCEPTION_CONTINUE_SEARCH.
  2. Matches — compares ExceptionAddress against the four known function addresses.
  3. Rewrites the context:
    • RIP = *(RSP) → "return" to the original caller by popping the return address.
    • RSP += 8 → simulate a ret (x64 single-instruction unwind).
    • RAX = 0 → spoof S_OK / ERROR_SUCCESS (successful return code).
    • DR6 &= ~0xF → clear the breakpoint status bits so the instruction can be re-executed later without spurious state.
  4. Mutates out-parameters (see 5.4).
  5. Returns EXCEPTION_CONTINUE_EXECUTION, which tells Windows to restart the thread with the modified context — i.e., execution resumes at the , and the real target function .

Each interception site is additionally wrapped in an SEH __try/__except guard so that a malformed or unexpected stack layout cannot crash the process — a robustness consideration for hostile/hardened targets.

5.4 Per-Component Interception Logic

DR0 — AmsiScanBuffer (x64, first 6 args in RCX, RDX, R8, R9, [RSP+0x28], [RSP+0x30]):

root@kitploit:~
HRESULT AmsiScanBuffer(HANDLE, PVOID, ULONG, LPCWSTR, HANDLE, AMSI_RESULT* pResult);
                                                        [RSP+0x28]  [RSP+0x30]
  • Writes AMSI_RESULT_CLEAN (0) to the 6th parameter (pResult, at [RSP+0x30]).
  • Returns S_OK (0) in RAX.

DR1 — AmsiScanString (x64, first 5 args in RCX, RDX, R8, R9, [RSP+0x28]):

root@kitploit:~
HRESULT AmsiScanString(HANDLE, LPCWSTR, LPCWSTR, HANDLE, AMSI_RESULT* pResult);
                                                       [RSP+0x28]
  • Writes AMSI_RESULT_CLEAN (0) to the 5th parameter (pResult, at [RSP+0x28]).
  • Returns S_OK (0) in RAX.

DR2 — WldpIsClassInApprovedList (first 3 args in RCX, RDX, R8):

root@kitploit:~
HRESULT WldpIsClassInApprovedList(const GUID* classId, PBOOL isApproved, DWORD evalCriteria);
                                         RCX             RDX             R8
  • Writes TRUE to *isApproved (via RDX).
  • Returns S_OK (0) in RAX.
  • Consequence: the evaluated content class is considered "approved" by the lockdown policy, and AMSI trusts that judgement for the class.

DR3 — EtwEventWrite (first 4 args in RCX, RDX, R8, R9):

root@kitploit:~
ULONG EtwEventWrite(HANDLE RegHandle, PCEVENT_DESCRIPTOR EventDescriptor,
                    ULONG UserDataCount, PEVENT_DATA_DESCRIPTOR UserData);
  • Returns ERROR_SUCCESS (0) in RAX without touching any output parameter.
  • Consequence: ETW providers receive no events from the hooked process, suppressing logging of script execution, module loads, process creation, and AMSI telemetry.

5.5 Thread Management & Hook Persistence

Because debug registers are per-thread, the engine must continuously maintain the hooks:

  1. Immediate hooking — DllMain (or InstallHook) hooks the calling thread with SetHwbpOnThread(GetCurrentThread()).
  2. All-thread sweep — HookAllThreads() enumerates every thread in the process via a TH32CS_SNAPTHREAD snapshot, suspends each foreign thread (SuspendThread), applies the breakpoints (SetHwbpOnThread), resumes it, and closes the handle. Suspension prevents a race where the thread faults mid-context-swap between GetThreadContext and SetThreadContext.
  3. Persistence monitor — MonitorThreadProc loops with Sleep(500) and calls HookAllThreads() every 500 ms. This re-arms any breakpoints that were removed (e.g., by an external call, a debugging tool, or thread teardown/creation) and .

Answer to the "hook persistence" question explicitly: yes — if the breakpoints are stripped from any thread (by another agent, a debugger, or an EDR), the monitor thread re-applies them within 500 ms. Additionally, any thread created after DLL load is hooked within one monitor cycle. The only reliable way to defeat this specific engine is to terminate the monitor thread and clear the VEH and strip the registers within the same window — or to use anti-debugging that denies SetThreadContext from the outset.


Exported API

Hit counters (g_HaveAmsiBuf, g_HaveAmsiStr, g_HaveWldp, g_HaveEtw) are maintained with InterlockedIncrement and are exposed in the debug output, which is useful for validating that interception is actually occurring in a lab environment.

Note that DllMain itself performs the full hooking sequence on DLL_PROCESS_ATTACH, so the exports are optional conveniences for runtime (un)loading scenarios.


Build Instructions

Requirements: Windows 10/11 x64, Visual Studio Build Tools (icx.exe), SDK.

Compile the DLL (x64):

root@kitploit:~
icx.exe /nologo /O3 /MT /EHsc "mora_hwbp.c" /link /DLL /out:"mora_hwbp.dll" /LIBPATH:"C:\Program Files (x86)\Intel\oneAPI\compiler\latest\lib"

Flags explained:

FlagPurpose

The result is mora_hwbp.dll, which can be loaded into a target process.


Injection & Usage Example

The DLL must be loaded into a process that uses AMSI/WLDP/ETW — a PowerShell host is the canonical test bed. Loading can be done with any standard DLL-injection technique. A minimal, self-contained demonstration using Reflective/LoadLibrary injection can be performed with a small C loader:

root@kitploit:~
rem Run from an x64 developer prompt (example with a generic loader)
loader.exe mora_hwbp.dll powershell.exe

Or, for a manual lab check, inject with your preferred tooling and then validate from PowerShell:

root@kitploit:~
# 1. Inject mora_hwbp.dll into the PowerShell process (via external tool).
# 2. Verify that classic AMSI test vectors now return clean.
"AmsiTestSample:7e72c3ce-861b-4339-8740-0ac1484c1386"

Lab validation only. Observe with a debugger or GetStats/OutputDebugString that all four breakpoints report hits as script content is executed.


Detection & Mitigation (Blue Team)

This POC is dual-purpose: the same characteristics that make it effective offensively are precisely what defenders should hunt for.

Indicators of Compromise (IOCs)

Recommended Mitigations

  1. Watchdog/self-monitoring agents — poll GetThreadContext(CONTEXT_DEBUG_REGISTERS) on high-value processes and audit any thread with nonzero DR0–DR3 outside approved debugger profiles.
  2. Kernel ETW auditing — enable Microsoft-Windows-Kernel-Process + Thread tracing and alert on NtGetContextThread/NtSetContextThread targeting security-relevant processes.
  3. EDR user-mode hook integrity — since hardware hooks bypass memory checks, rely on behavioral detection (ETW consumer hooks below EtwEventWrite, kernel ETW, AMSI consumer re-check) rather than .text integrity alone.
  4. Protect the monitor — in genuinely hostile environments, treat per-thread SetThreadContext to other processes as an explicit high-severity signal.
  5. Endpoint hardening — enable WDAC (which this POC explicitly bypasses for class approval — do not treat WDAC as a standalone defense against in-memory tooling), Credential Guard, and LSASS protection where applicable.

Known Limitations

  • x64-only — the stack-offset rewrites assume the x64 calling convention (arguments RCX/RDX/R8/R9 then [RSP+0x20…]). An x86 variant would need [EBP+…]-style parameter reconstruction.
  • Four slots only — the x64 architecture offers exactly four breakpoint registers; you cannot hook more than four functions per thread with this method alone.
  • Monitor race window — there is an (intentionally small) window between Sleep(500) iterations; extremely fast thread spawning combined with aggressive stripping could theoretically out-run the monitor for a few hundred milliseconds.
  • Anti-debug interference — any component that actively monitors or clears debug registers (a real debugger, some sandboxes, certain EDRs) will interfere with the technique.
  • OutputDebugStringA-based status — diagnostics rely on a debug output channel; in a fully stripped/headless environment you should attach a debugger or redirect the output for lab observation.
  • Not a memory-persistence primitive — this is a runtime-only, in-process technique. It provides no disk/registry persistence, no privilege escalation, and no cross-process lateral movement by itself. Its entire purpose is the controlled study of one interception primitive.

References

  • Microsoft Learn — Antimalware Scan Interface (AMSI)
  • Microsoft Learn — Windows Lockdown Policy (WLDP)
  • Microsoft Learn — Event Tracing for Windows (ETW)
  • Microsoft Learn — CONTEXT structure & Debug Registers
  • Intel® 64 and IA-32 Architectures Software Developer's Manual, Vol. 3B — Debug Registers (Dr0–Dr7, #DB exception)

License & Responsible Disclosure

This project is licensed under the MIT License - see the LICENSE file for details.

This project is released for educational and defensive research purposes only. If you are a security vendor, blue team, or detection engineer, you are encouraged to use the contents of this repository to improve your detection coverage for hardware-breakpoint-based evasion. If you discovered this technique being abused in the wild, report it through your organization's responsible-disclosure process and the relevant vendor/authority channels.

Use at your own risk. Unauthorized use of this technique may violate applicable laws.

Download Tool
RegisterHooked FunctionModulePurpose
DR0AmsiScanBufferamsi.dllNeutralize AMSI content scanning
DR1AmsiScanStringamsi.dllNeutralize AMSI string scanning
DR2WldpIsClassInApprovedListwldp.dllForce WLDP class approval (Device Guard / WDAC)
DR3EtwEventWritentdll.dllSuppress ETW event tracing
BitsFieldMeaning
0L0Local enable for breakpoint 0 (DR0)
2L1Local enable for breakpoint 1 (DR1)
4L2Local enable for breakpoint 2 (DR2)
6L3Local enable for breakpoint 3 (DR3)
8LELegacy local enable (kept for compatibility)
9GELegacy global enable (kept for compatibility)
16–17R/W0Access type for BP0 (00 = instruction execution)
18–19Len0Length for BP0 (00 = 1 byte)
20–21R/W1Access type for BP1 (00 = instruction execution)
22–23Len1Length for BP1 (00 = 1 byte)
24–25R/W2Access type for BP2 (00 = instruction execution)
26–27Len2Length for BP2 (00 = 1 byte)
28–29R/W3Access type for BP3 (00 = instruction execution)
30–31Len3Length for BP3 (00 = 1 byte)
caller
never runs
SetThreadContext
covers threads created after the initial hook
  • Synchronization — HookAllThreads runs under a CRITICAL_SECTION (g_HookLock) so the monitor thread and the initial hooking routine never interleave context switches.
  • Clean teardown — UninstallHook stops the monitor, clears DR0–DR7 on every thread, and deregisters the VEH.
  • ExportSignatureBehavior
    InstallHookBOOL WINAPI InstallHook(void)Resolves targets, registers VEH, hooks all threads, starts monitor.
    UninstallHookBOOL WINAPI UninstallHook(void)Stops monitor, clears breakpoints on all threads, removes VEH.
    GetStatsvoid WINAPI GetStats(void)Emits current hook status (via OutputDebugStringA) — address, hit counters.
    /O3
    Maximum optimization (function code, not required)
    /MTStatic CRT linkage (no runtime DLL dependency)
    /EHscC++/SEH exception handling (needed for __try)
    /DLLProduce a DLL with an export table
    ArtifactObservable
    GetThreadContext / SetThreadContext callsHigh-frequency debug-register context switches on other processes/threads (kernel ETW: Microsoft-Windows-Kernel-Process/Thread APIs).
    Nonzero DR0–DR3Any thread whose CONTEXT_DEBUG_REGISTERS contain a user-mode address outside known debugger workflows.
    DR7 local-enable bits (L0–L3) with R/W = 00Execute-only breakpoints on non-debugger-managed threads — a strong anomaly.
    EXCEPTION_SINGLE_STEP volumeHigh rates of #DB faults (0x80000004) originating from a process's VEH.
    First-chance VEH registrationNewly added VEH (AddVectoredExceptionHandler) shortly before #DB storm.
    TH32CS_SNAPTHREAD + SuspendThread/ResumeThreadRepeated thread enumeration + suspension patterns (used by the 500 ms monitor).
    Load of wldp.dll/amsi.dll via LoadLibraryW when not previously loadedAnomalous module loads in the target process.
    EtwEventWrite never reachedAbsence of expected ETW events (PowerShell operational logs silent while scripts run).