 corelight/zeek2es
A Python application to filter and transfer Zeek logs to Elastic/OpenSearch+Humio. This app can also output pure JSON logs to stdout for further processing!

This Python application translates Zeek's ASCII TSV and JSON logs into ElasticSearch's bulk load JSON format.
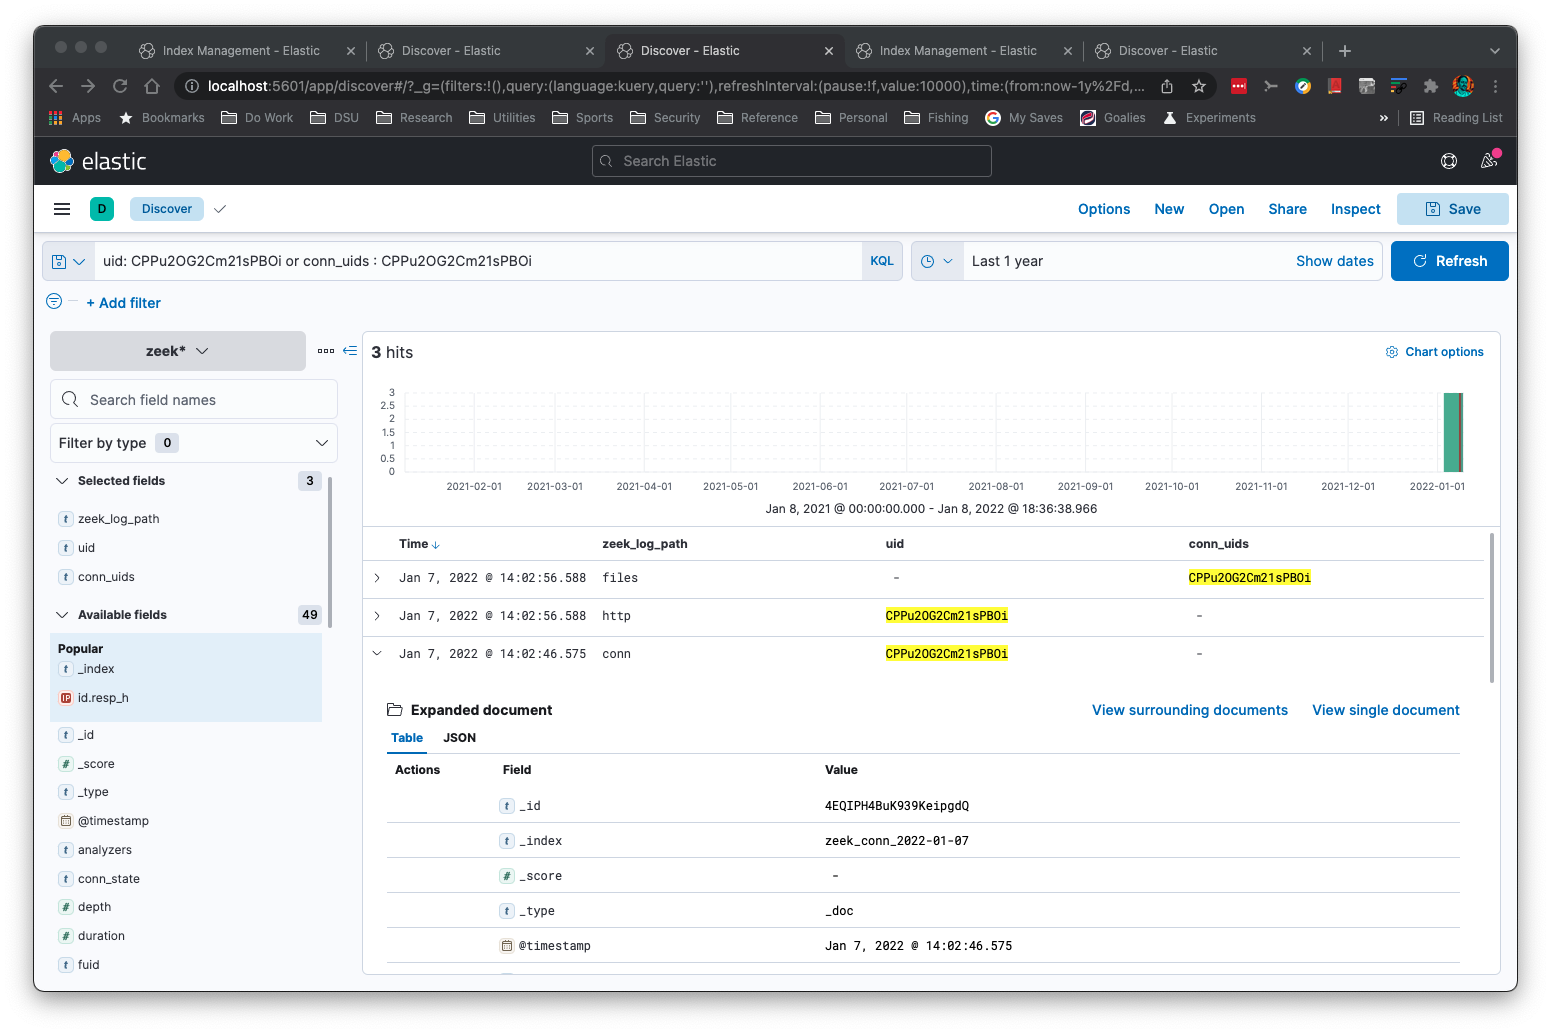
Want to see multiple Zeek logs for the same connection ID (uid) or file ID (fuid)? Here are the hits from files.log, http.log, and conn.log for a single uid:
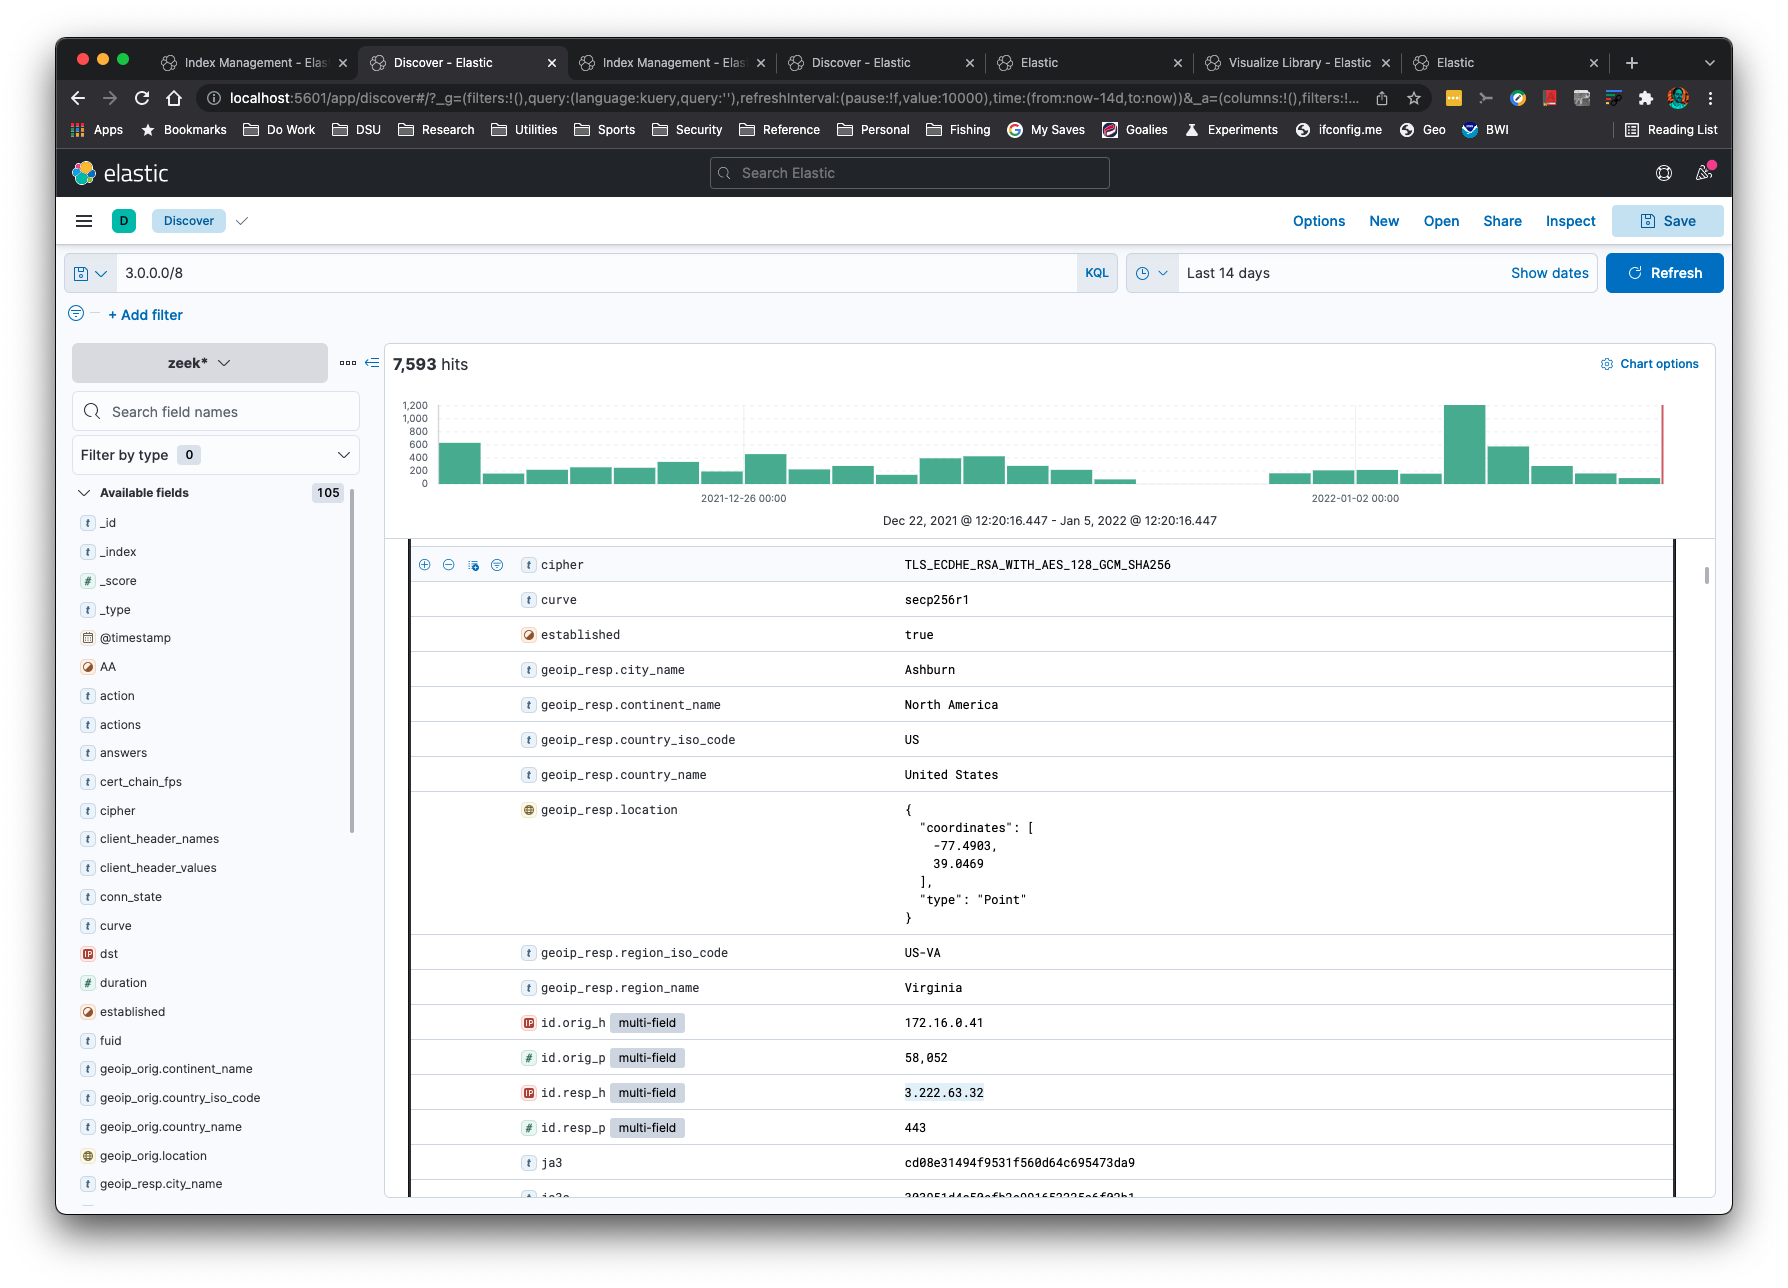
You can perform subnet searching on Zeek's 'addr' type:
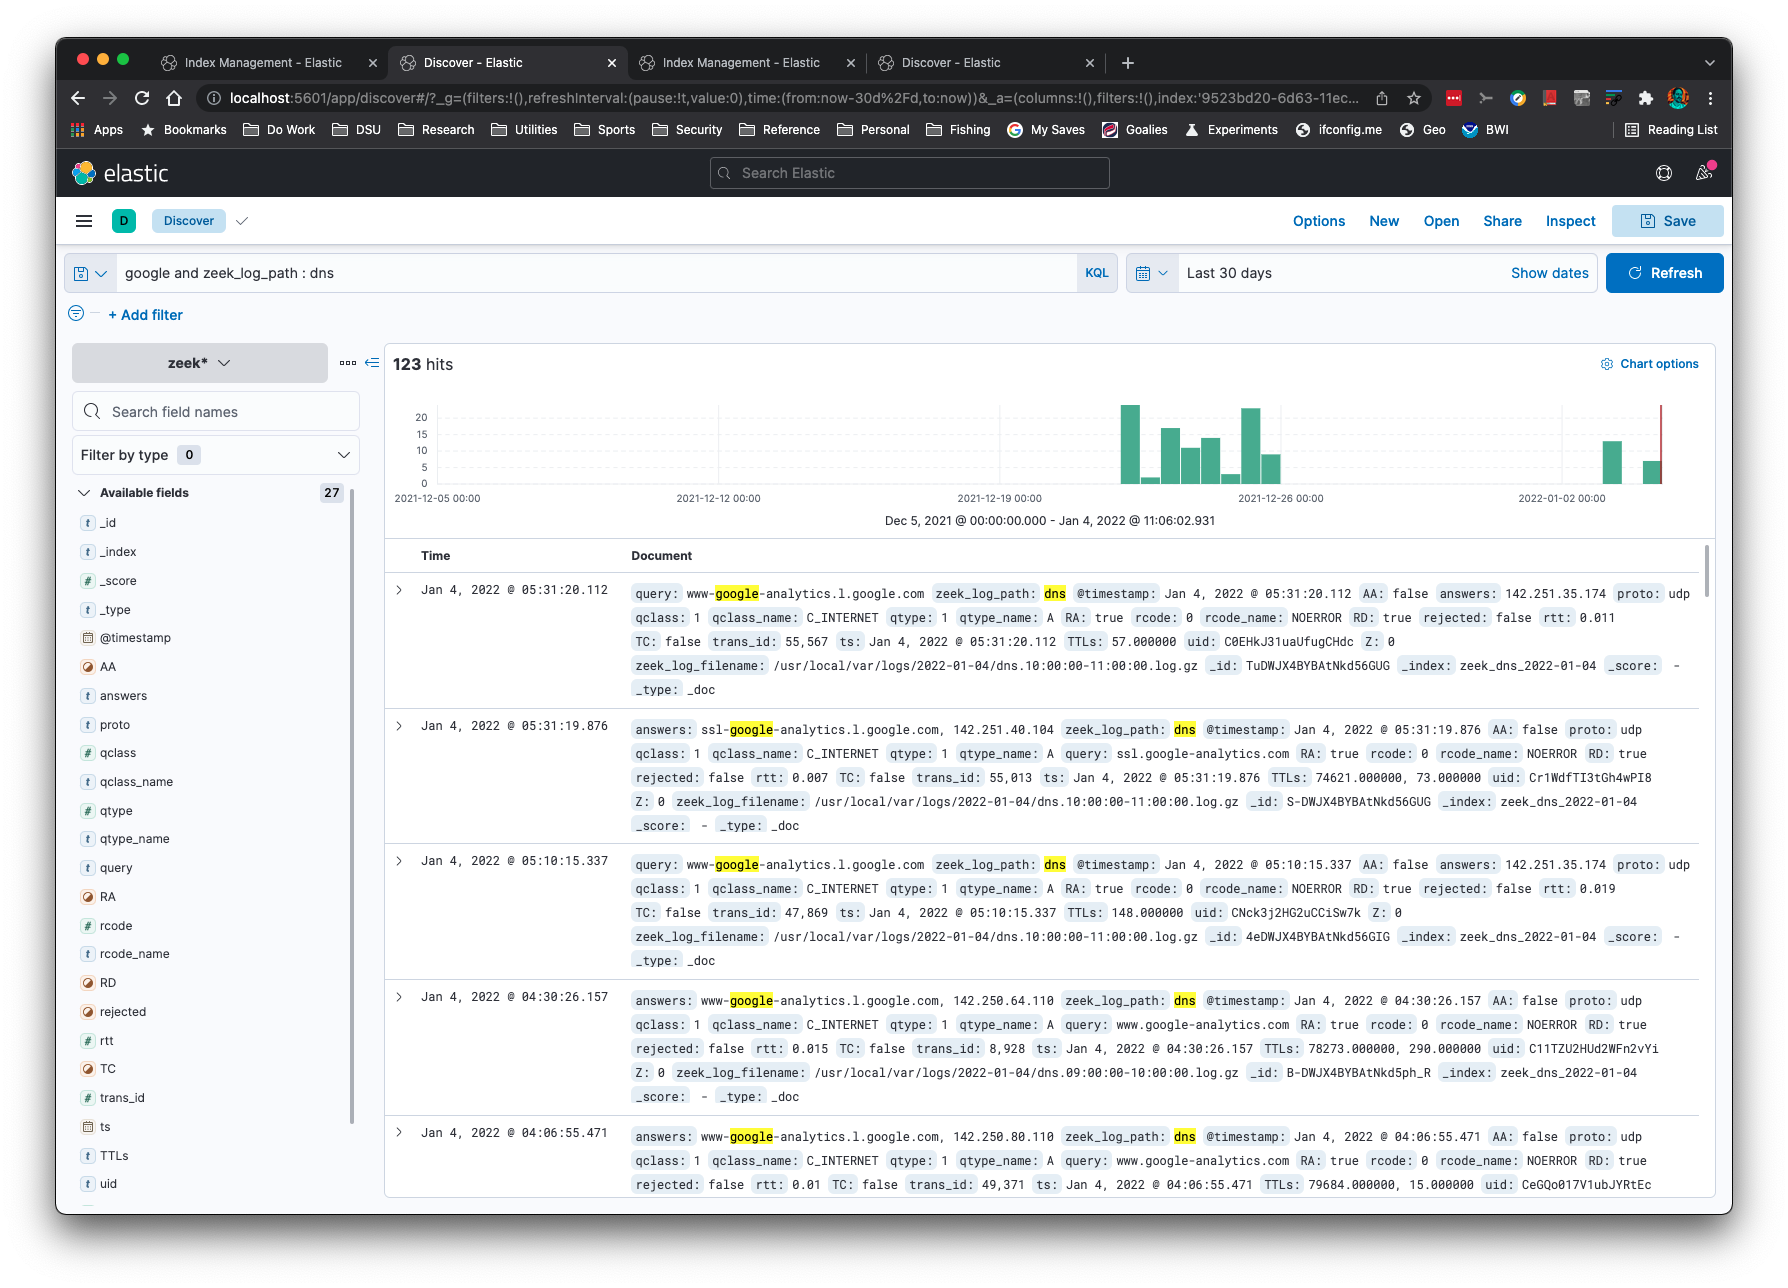
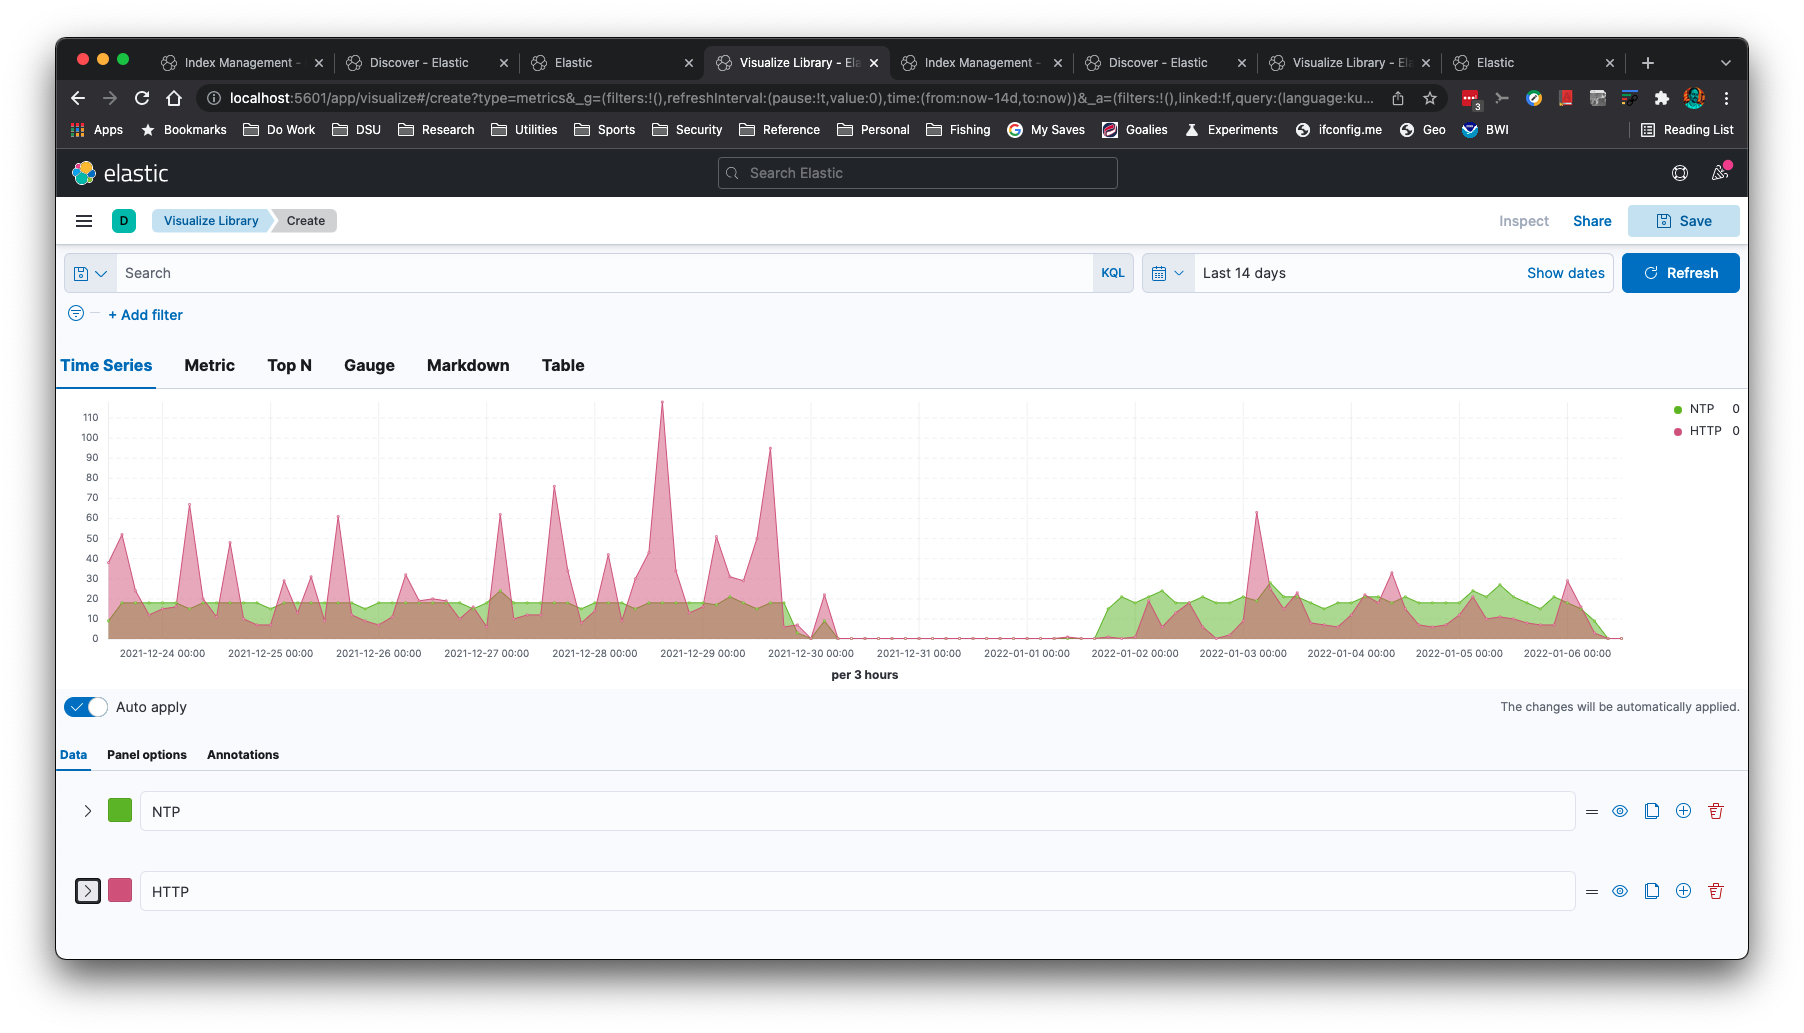
You can create time series graphs, such as this NTP and HTTP graph:
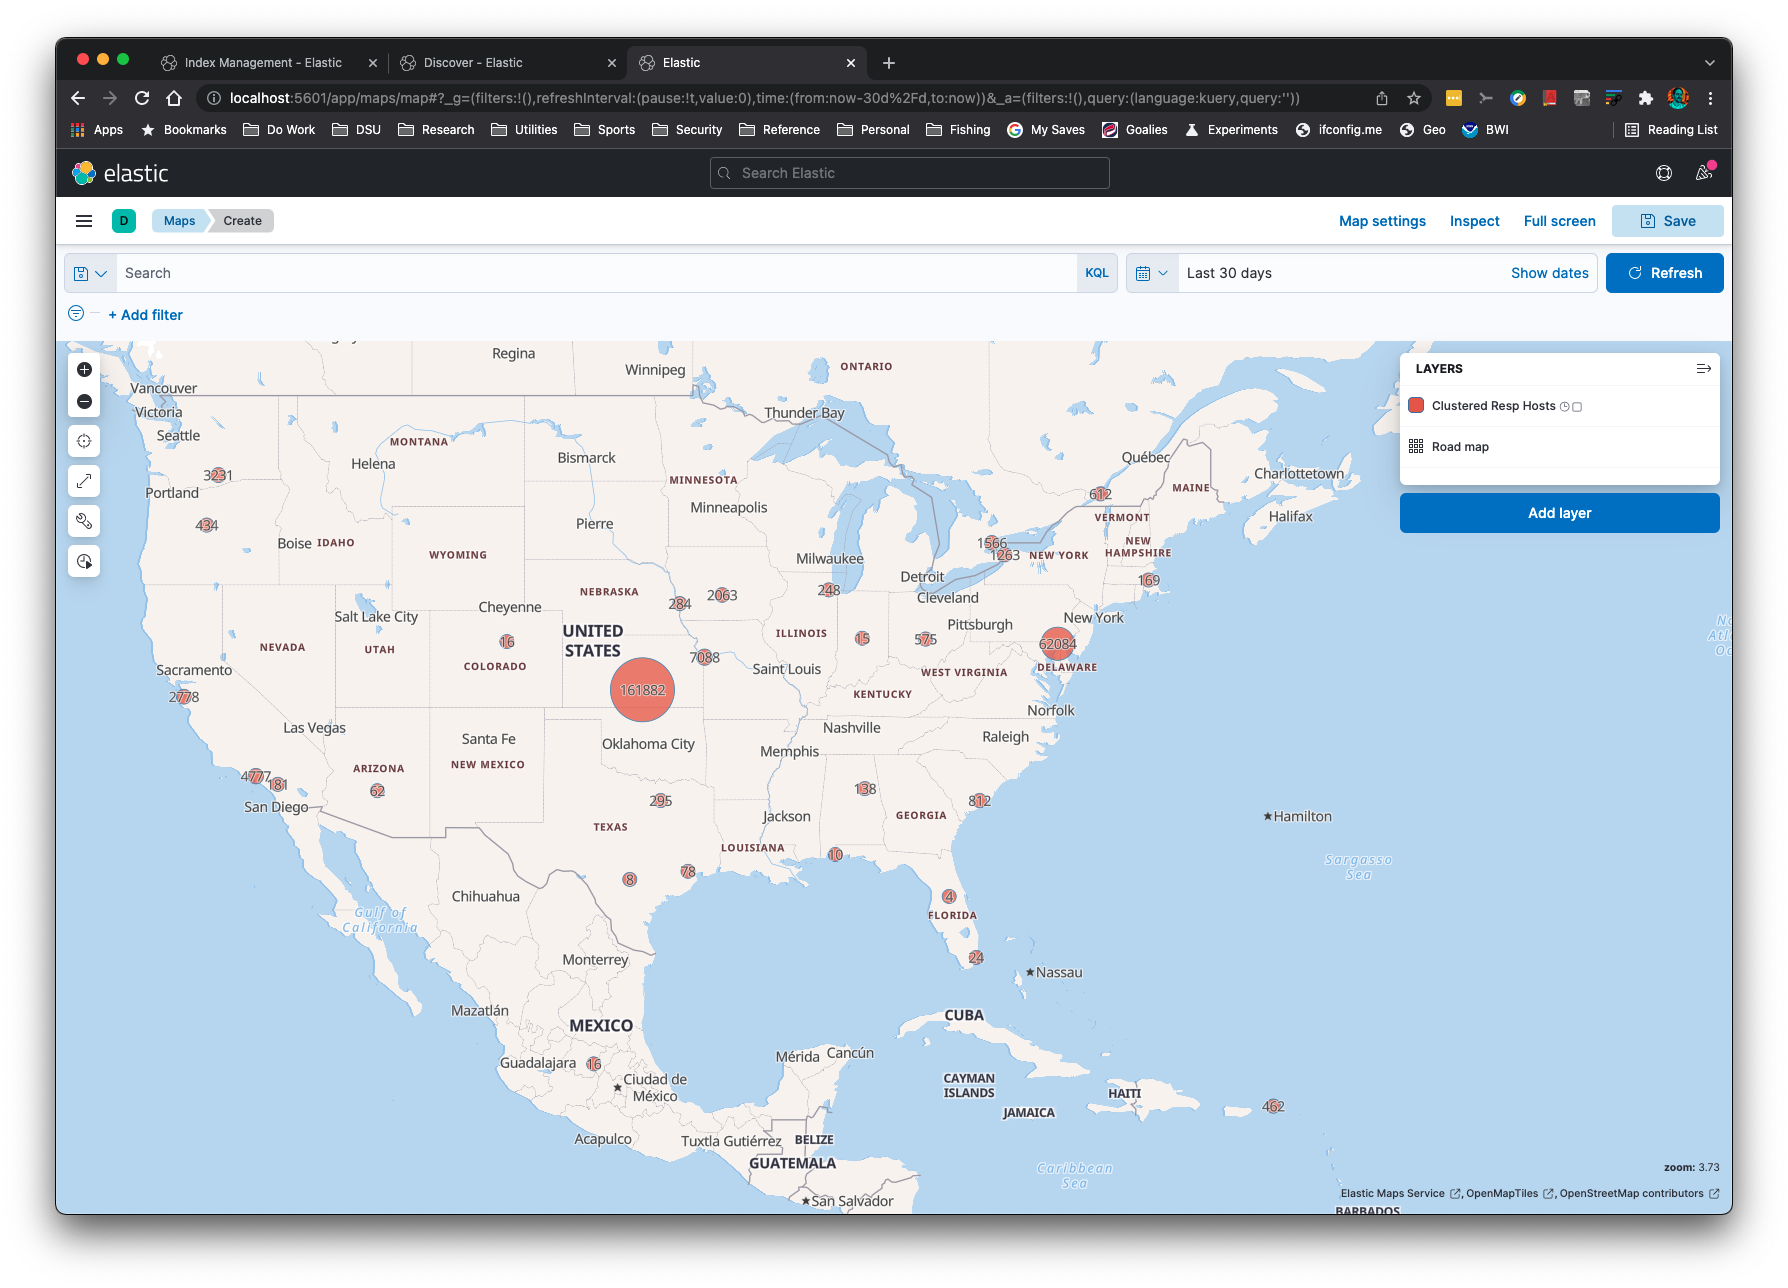
IP Addresses can be Geolocated with the -g command line option:
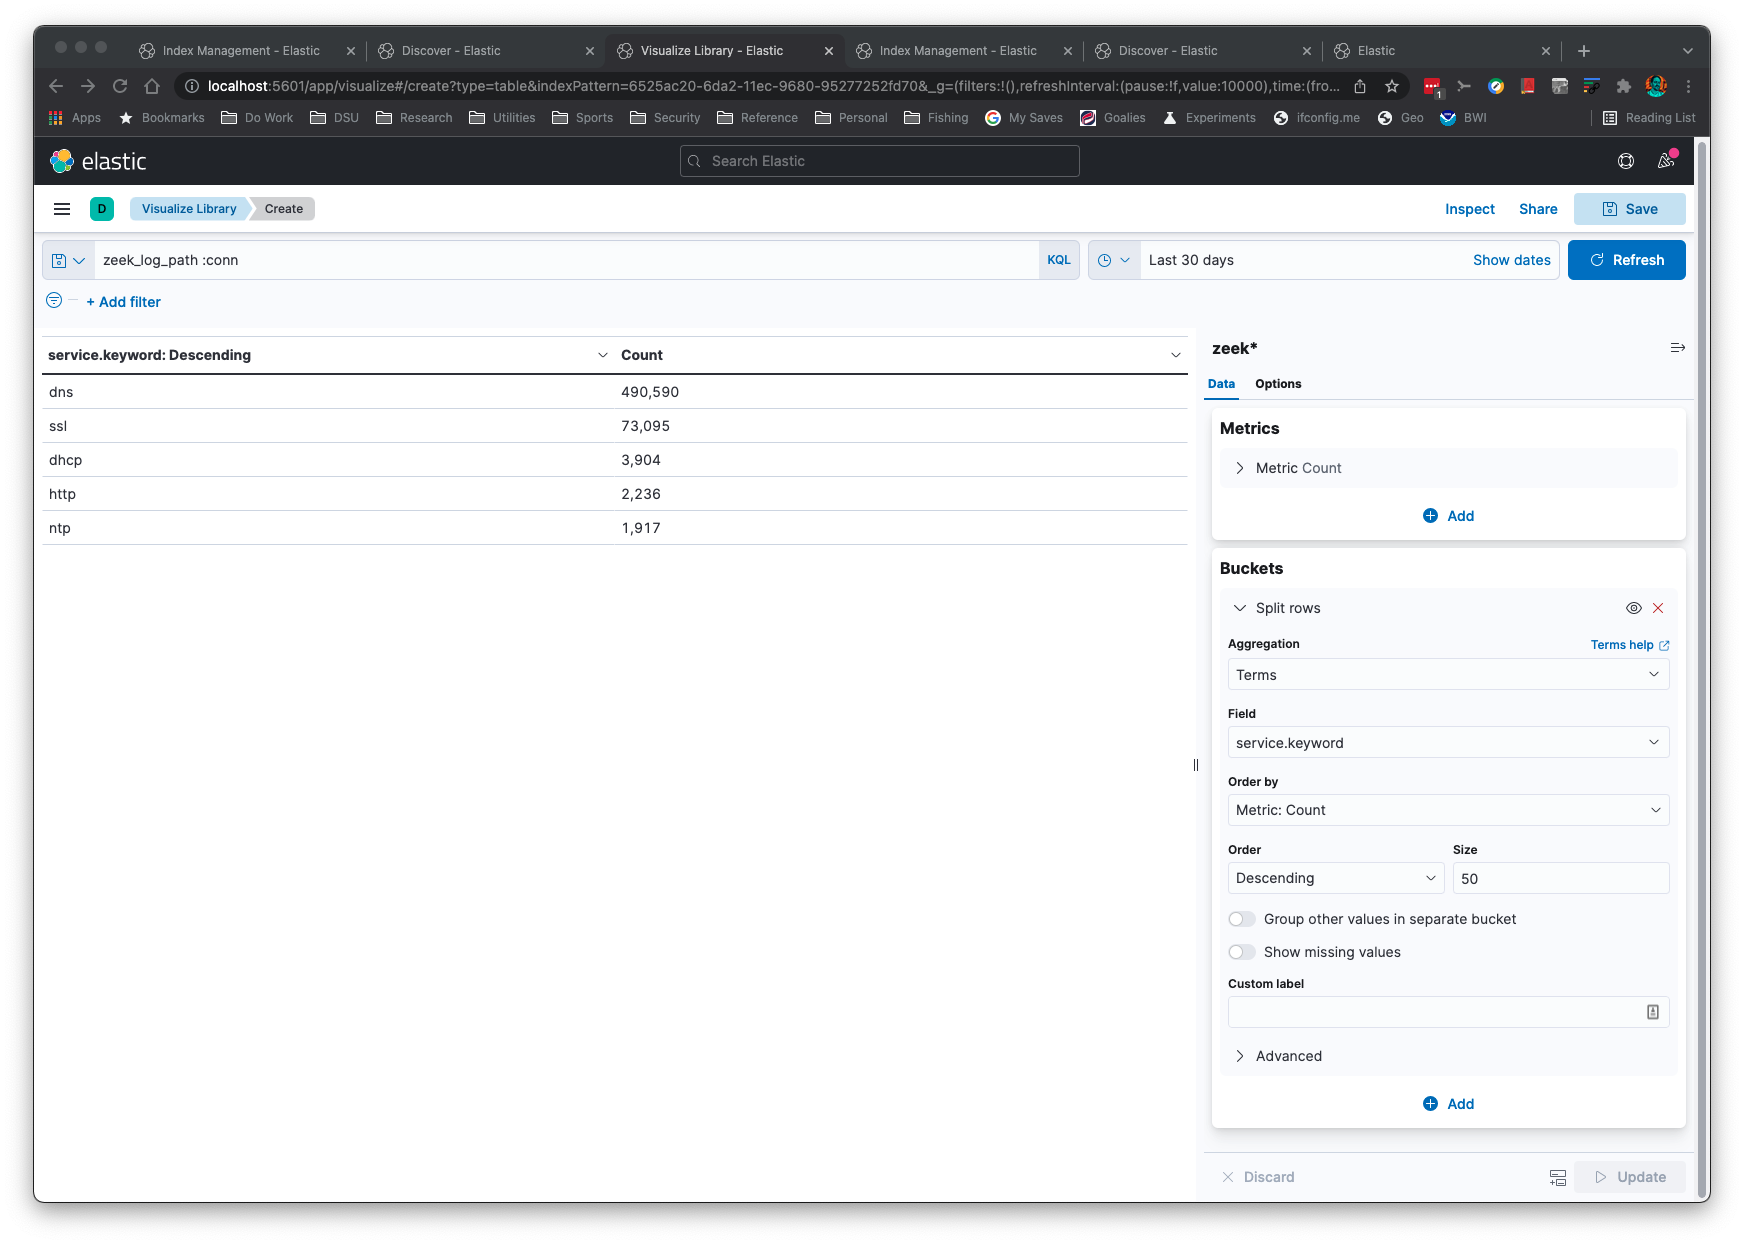
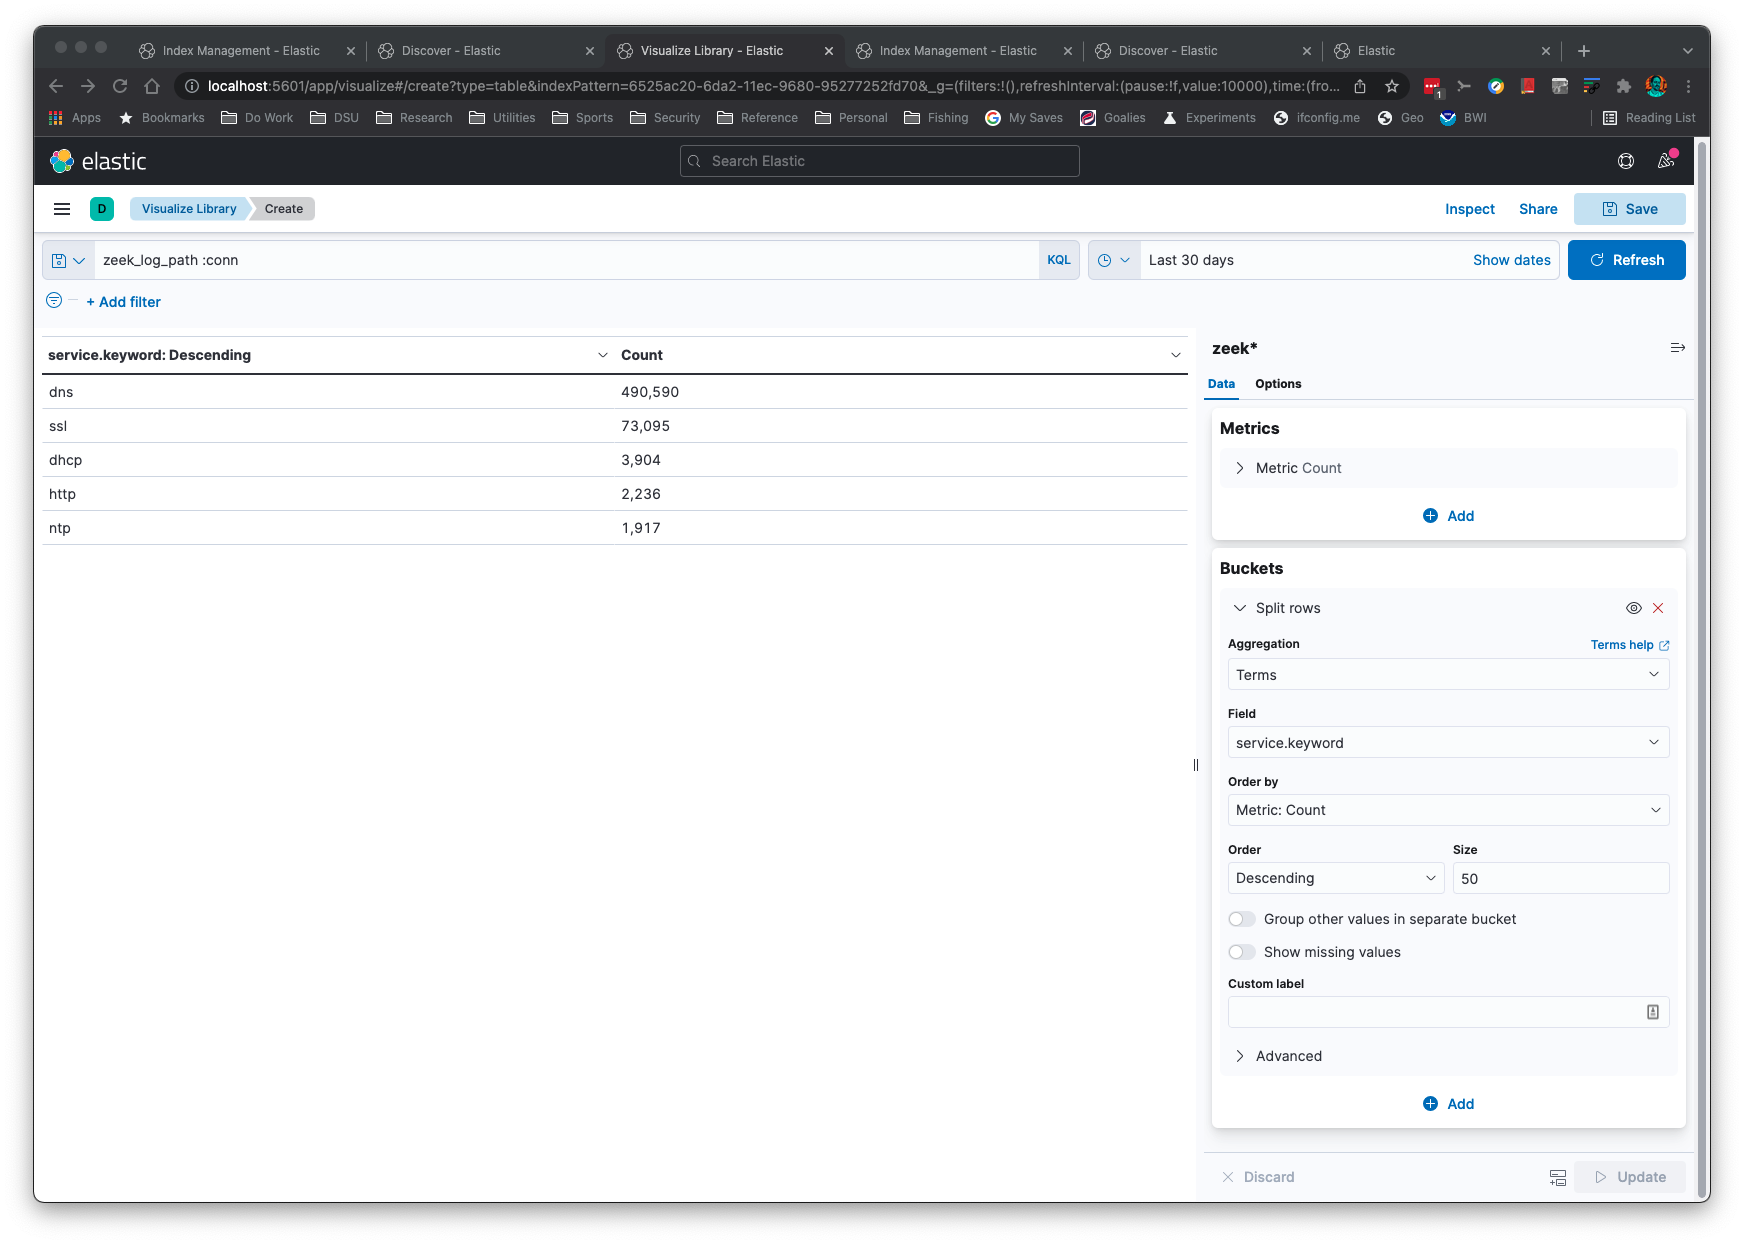
Aggregations are simple and quick:
This application will "just work" when Zeek log formats change. The logic reads the field names and associated types to set up the mappings correctly in ElasticSearch.
This application will recognize gzip or uncompressed logs. This application assumes
you have ElasticSearch set up on your localhost at the default port.
If you do not have ElasticSearch you can output the JSON to stdout with the -s -b command line options
to process with the jq application.
You can add a keyword subfield to text fields with the -k command line option. This is useful
for aggregations in Kibana.
If Python is already on your system, there is nothing additional for you to copy over to your machine than Elasticsearch, Kibana, and zeek2es.py if you already have the requests library installed.
Assuming you meet the requirements, there is none. You just
copy zeek2es.py to your host and run it with Python. Once Zeek
logs have been imported with automatic index name generation (meaning, you did not supply the -i option)
you will find your indices named "zeek_zeeklogname_date", where zeeklogname is a log name like conn
and the date is in YYYY-MM-DD format. Set your Kibana index pattern to match zeek* in this case. If
you named your index with the -i option, you will need to create a Kibana index pattern that
matches your naming scheme.
If you are upgrading zeek2es, please see the section on upgrading zeek2es.
If you are using Elastic v8.0+, it has security enabled by default. This adds a requirement of a username and password, plus HTTPS.
If you want to be able to delete indices/data streams with wildcards (as examples in this readme show),
edit elasticsearch.yml with the following line:
action.destructive_requires_name: false
You will also need to change the curl commands in this readme to contain -k -u elastic:<password>
where the elastic user's password is set with a command like the following:
./bin/elasticsearch-reset-password -u elastic -i
You can use zeek2es.py with the --user and --passwd command line options to specify your
credentials to ES. You can also supply these options via the extra command line arguments for the helper
scripts.
Probably the easiest way to use this code is through Docker. All of the files are in the docker directory.
First, you will want to edit the lines with CHANGEME!!! in the .env file to fit your environment.
You will also need to edit the Elastic password in docker/zeek2es/entrypoint.sh to match. It can be found after the --passwd option.
Next, you can change directory into the docker directory and type the following commands to bring
up a zeek2es and Elasticsearch cluster:
docker-compose build
dockr-compose up
Now you can put logs in the VOLUME_MOUNT/data/logs directory (VOLUME_MOUNT you set in the .env file).
When logs are CREATED in this directory, zeek2es will begin processing them and pushing them into Elasticsearch.
You can then login to https://localhost:5601 with the username and password you set up in the .env file.
By default there is a self signed certificate, but you can change that if you edit the docker compose files. Once inside
Kibana you will go to Stack Management->Data Views and create a data view for logs* with the timestamp @timestamp.
Now you will be able to go to Discover and start searching your logs! Your data is persistent in the VOLUME_MOUNT/data directory you set.
If you would like to remove all data, just rm -rf VOLUME_MOUNT/data, substituting the directory you set into that remove command.
The next time you start your cluster it will be brand new for more data.
Most upgrades should be as simple as copying the newer zeek2es.py over
the old one. In some cases, the ES ingest pipeline required for the -g command line option
might change during an upgrade. Therefore, it is strongly recommend you delete
your ingest pipeline before you run a new version of zeek2es.py.
If you need to delete the "zeekgeoip" ES ingest pipeline
used to geolocate IP addresses with the -g command line option, you can either do it graphically
through Kibana's Stack Management->Ingest Pipelines or this command will do it for you:
curl -X DELETE "localhost:9200/_ingest/pipeline/zeekgeoip?pretty"
This command is strongly recommended whenever updating your copy of zeek2es.py.
zeek2es provides filtering capabilities for your Zeek logs before they are stored in ElasticSearch. This
functionality can be enabled with the -a or -f options. The filters are constructed from Python
lambda functions, where the input is a Python dictionary representing the output. You can add a
filter to only store connection logs where the service field is populated using the -f option with
this lambda filter file:
lambda x: 'service' in x and len(x['service']) > 0
