 bootleg/ret-sync
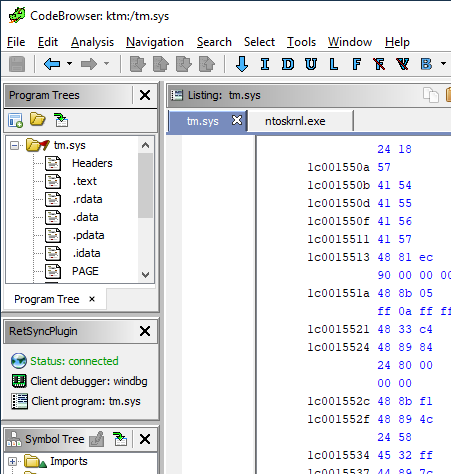
ret-sync is a set of plugins that helps to synchronize a debugging session (WinDbg/GDB/LLDB/OllyDbg2/x64dbg) with IDA/Ghidra/Binary Ninja disassemblers.

ret-sync stands for Reverse-Engineering Tools SYNChronization. It is a set of plugins that help to synchronize a debugging session (WinDbg/GDB/LLDB/OllyDbg/OllyDbg2/x64dbg) with a disassembler (IDA/Ghidra/Binary Ninja). The underlying idea is simple: take the best from both worlds (static and dynamic analysis).
Debuggers and dynamic analysis provide us with:
!peb, !drvobj,
!address, etc.)Disassemblers and static analysis provide us with:
Key features:
ret-sync is a fork of qb-sync that I developed and maintained during my stay at Quarkslab.
The debugger plugins:
ext_windbg/sync: WinDbg extension source files, once built: sync.dllext_gdb/sync.py: GDB pluginext_lldb/sync.py: LLDB pluginext_olly1: OllyDbg 1.10 pluginext_olly2: OllyDbg v2 pluginext_x64dbg: x64dbg pluginThe disassembler plugins:
ext_ida/SyncPlugin.pyext_ghidra/dist/ghidra_*_retsync.zip: Ghidra pluginext_bn/retsync: Binary Ninja pluginAnd the library plugin:
ext_lib/sync.py: standalone Python libraryIDA and GDB plugins require a valid Python setup. Python 2 (>=2.7) and Python 3 are supported.
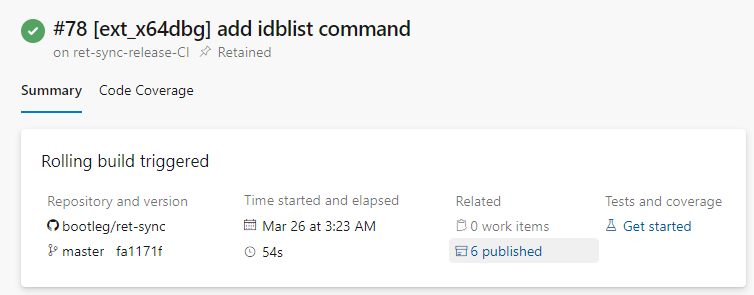
Pre-built binaries for WinDbg/OllyDbg/OllyDbg2/x64dbg debuggers are proposed
through an Azure DevOps pipeline:
Select the last build and check the artifacts under the Related section: 6 published.
A pre-built plugin archive of the Ghidra plugin is provided in ext_ghidra/dist.
ret-sync should work out of the box for most users with a typical setup: debugger and disassembler(s) on the same host, module names matching.
Still, in some scenarios a specific configuration may be used. For that,
extensions and plugins check for an optional global configuration file named
.sync in the user's home directory. It must be a valid .INI file.
Additionally, the IDA and Ghidra plugins also look for the configuration file
in the IDB or project directory (<project>.rep) first to allow local,
per-IDB/project, settings. If a local configuration file is present, the
global configuration file is ignored.
Values declared in these configuration files override default values. Please
note, that no .sync file is created by default.
Below we detail, three common scenarios where a configuration file is useful/needed:
The [INTERFACE] section is used to customize network related settings.
Let's suppose one wants to synchronize IDA with a debugger running inside a
virtual machine (or simply another host), common remote kernel debugging
scenario.
Simply create two .sync file:
[INTERFACE]
host=192.168.128.1
port=9234
It tells ret-sync IDA plugin to listen on the interface
192.168.128.1 with port 9234. It goes without saying that this
interface must be reachable from the remote host or virtual machine.
[INTERFACE]
host=192.168.128.1
port=9234
It tells ret-sync debugger plugin to connect to the ret-sync IDA
plugin configured previously to listen in this interface.
NOTE: You must specify a real IP here, and not use 0.0.0.0. This is
because the variable is used by multiple sources both for binding and
connecting, so using 0.0.0.0 will result in weird errors.
[ALIASES]
ntoskrnl_vuln.exe=ntkrnlmp.exe
The [ALIASES] section is used to customize the name which is used by a
disassembler (IDA/Ghidra) to register a module to its dispatcher/program
manager.
By default, disassembler plugins use the name of the input file. However one may have renamed the file beforehand and it doesn't match anymore the name of the actual process or loaded module as seen by the debugger.
Here we simply tell to the dispatcher to match the name ntkrnlmp.exe (real
name) instead of ntoskrnl_vuln.exe (IDB name).
The Qt Creator debugging frontend changes the way gdb command output is logged. Since this would interfere with the synchronization an option exists to use the raw gdb output for synchronization instead of a temporary file. In the .sync configuration file use
[GENERAL]
use_tmp_logging_file=false
if you wish to use the Qt debugging frontend for the target.
/proc/<pid>/mapsIn some scenarios, such as debugging embedded devices over serial or raw
firmware in QEMU, gdb is not aware of the PID and cannot access
/proc/<pid>/maps.
In these cases, The [INIT] section is used to pass a custom context to the
plugin. It allows overriding some fields such as the PID and memory mappings.
.sync content extract:
[INIT]
context = {
      "pid": 200,
      "mappings": [ [0x400000, 0x7A81158, 0x7681158, "asav941-200.qcow2|lina"] ]
  }
Each entry in the mappings is: mem_base, mem_end, mem_size, mem_name.
