
Real-time monitoring and slowlog analysis for Valkey and Redis databases with anomaly detection, ACL auditing, and Prometheus metrics export.
The monitoring layer that Valkey deserves.
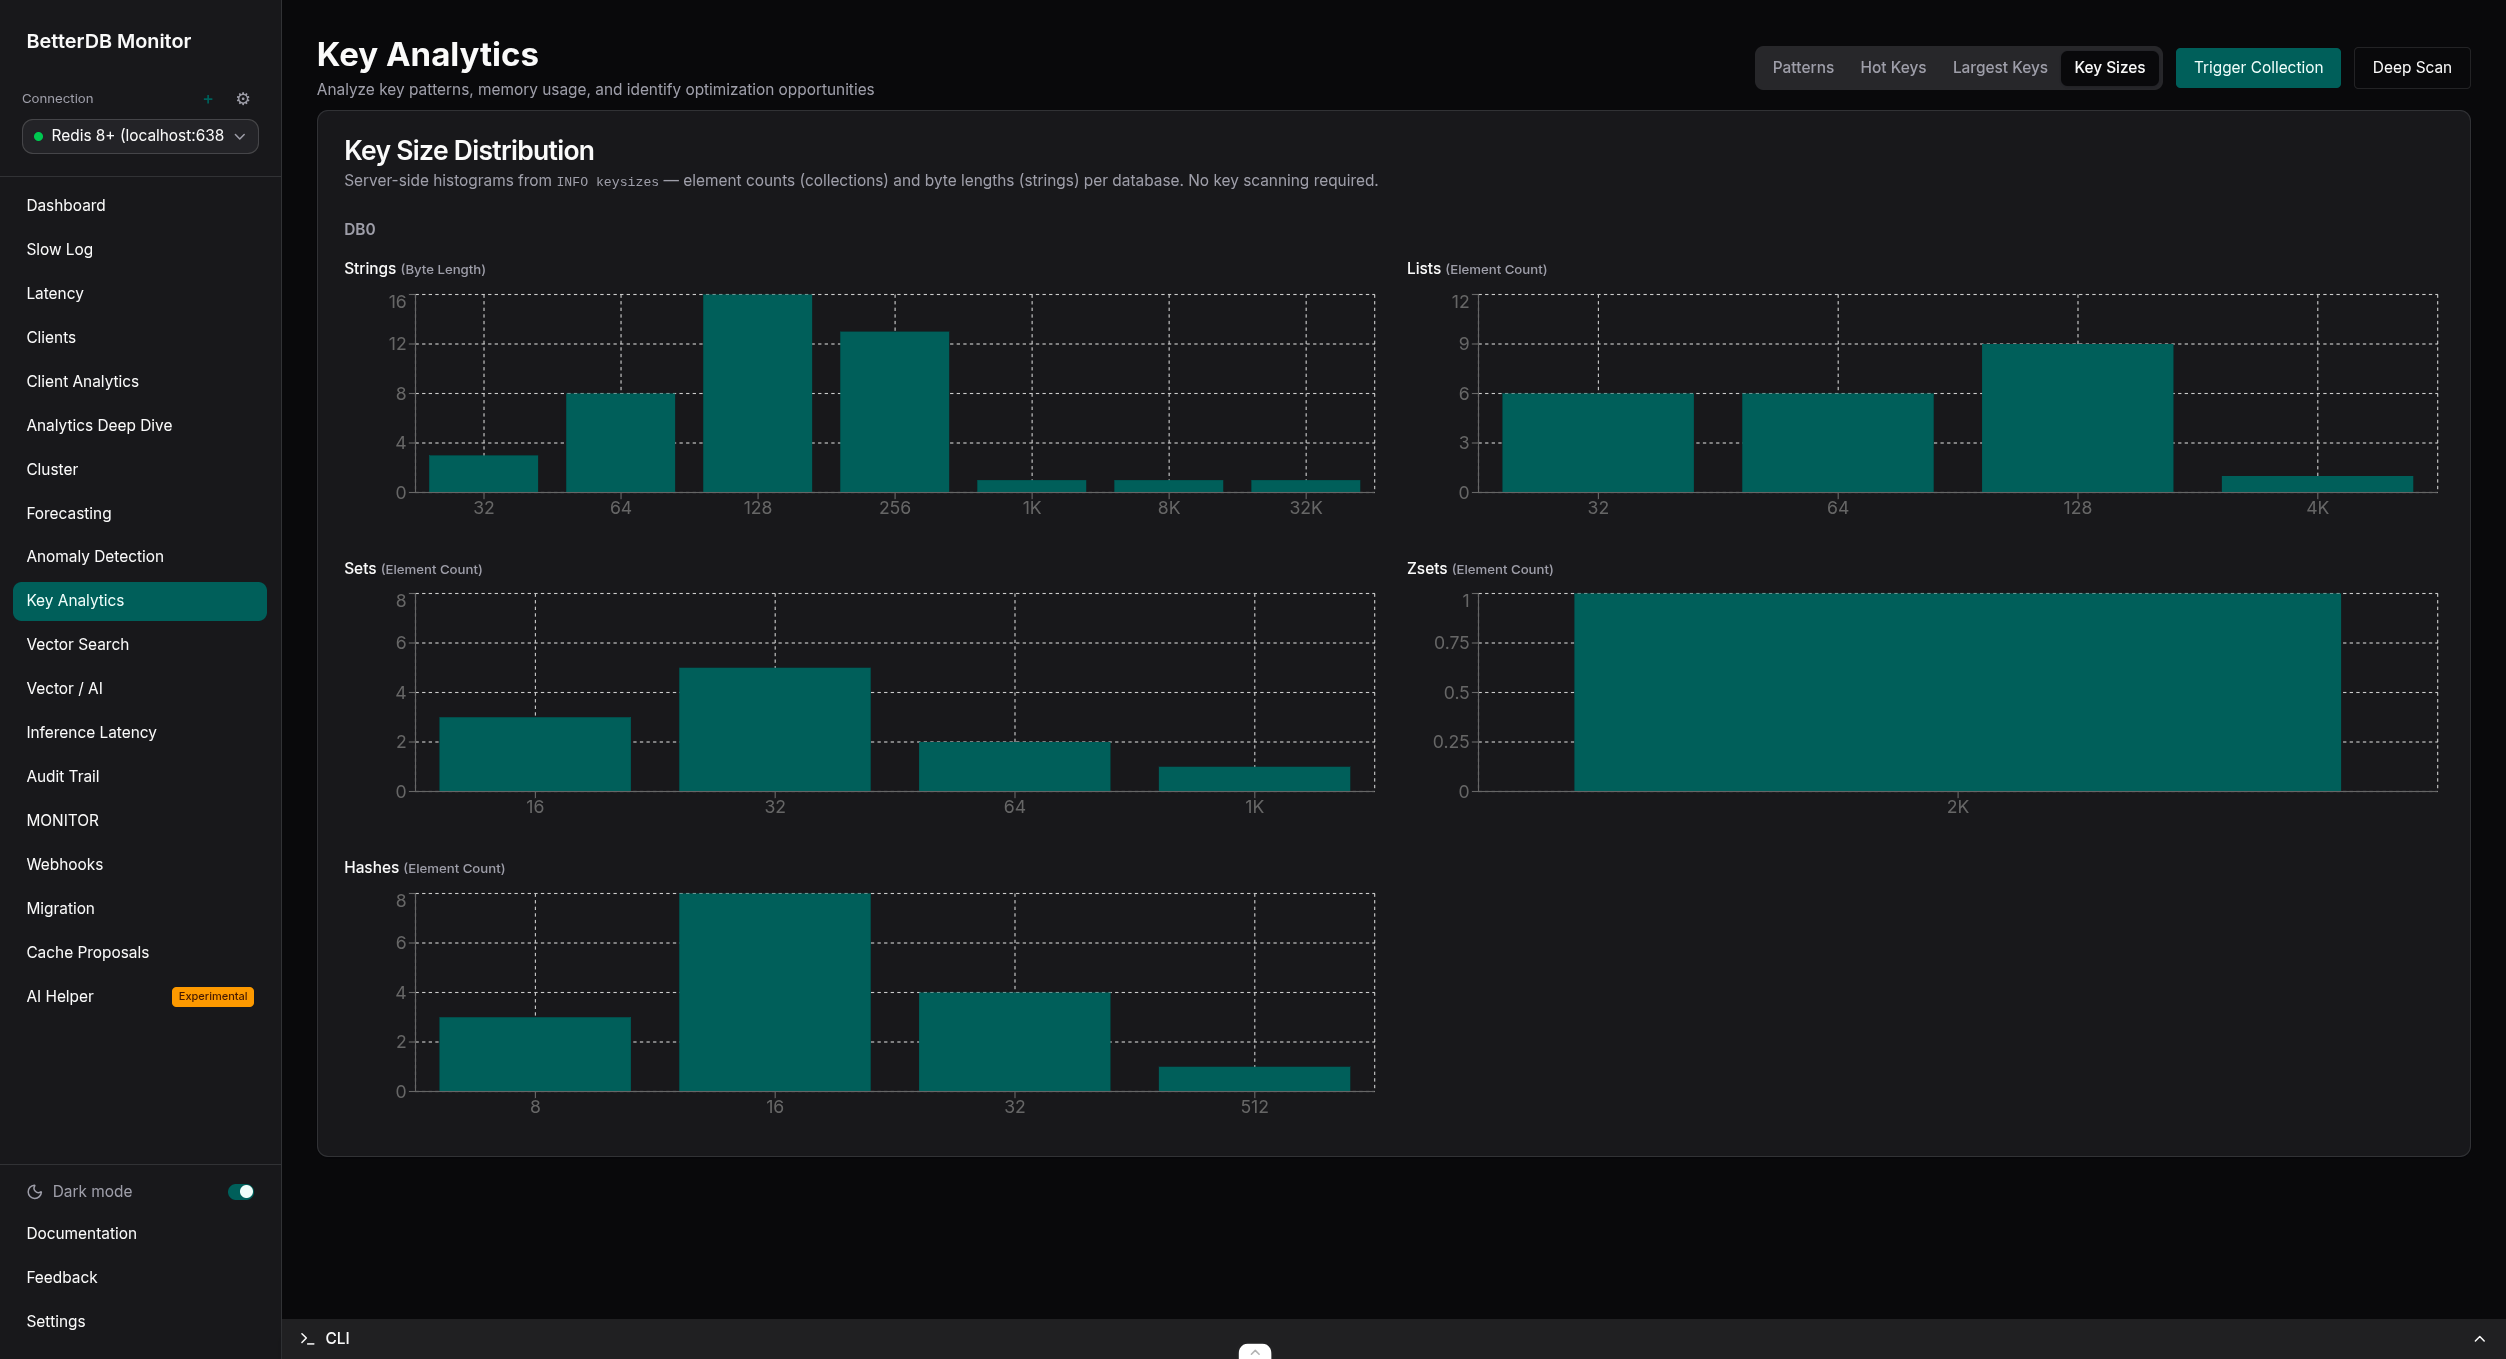
BetterDB persists what Valkey throws away - slowlogs, command patterns, client activity, anomaly signals - so you can debug what happened at 3am, not just what's happening now. Built for Valkey 8.x with native support for COMMANDLOG, CLUSTER SLOT-STATS, and per-thread I/O metrics. Redis 6+ compatible for everything else.
Website | Docker Hub | npm | Documentation | Blog
BetterDB is built by BetterDB Inc., a public benefit company operating under the OCV Open Charter.
docker run -d --name betterdb -p 3001:3001 betterdb/monitor:latest
Point your browser to http://localhost:3001. To monitor a specific instance:
docker run -d \
--name betterdb \
-p 3001:3001 \
-e DB_HOST=your-valkey-host \
-e DB_PORT=6379 \
-e DB_PASSWORD=your-password \
betterdb/monitor:latest
Two image variants are published, both multi-arch (linux/amd64, linux/arm64):
| Tag | What it is |
|---|---|
latest, X.Y.Z-no-ai | Default image - every monitoring feature included, without the dependencies for the experimental local-LLM AI Helper |
X.Y.Z | Adds the experimental AI Helper (bring your own Ollama; disabled by default via AI_ENABLED) |
See Docker Production Deployment for persistent storage, custom ports, licensing, and air-gapped setups.
Run BetterDB Monitor without Docker:
npx @betterdb/monitor
On first run, an interactive setup wizard guides you through database connection, storage backend (SQLite, PostgreSQL, or in-memory), and server settings. Configuration is saved to ~/.betterdb/config.json.
npm install -g @betterdb/monitor # global install
betterdb --setup # re-run setup wizard
betterdb --port 8080 # override server port
betterdb --db-host 1.2.3.4 # override database host
betterdb --help # all options
Requires Node.js >= 20.0.0 and a Valkey or Redis instance to monitor. For SQLite storage, also npm install -g better-sqlite3.
@betterdb/mcp.betterdb_* metrics. See docs/prometheus-metrics.md.Note: In production builds (Docker, CLI) API routes are served under the
/apiprefix. In local development (pnpm dev) there is no prefix - e.g.http://localhost:3001/health.
| Database | Minimum Version | Supported Features |
|---|---|---|
| Valkey | 8.0+ | All features including COMMANDLOG (8.1+) and CLUSTER SLOT-STATS |
| Redis | 6+ | All features except the Valkey-exclusive COMMANDLOG and CLUSTER SLOT-STATS |
The backend uses a unified adapter over the wire-compatible iovalkey client and auto-detects Valkey vs Redis from the INFO response (DB_TYPE=auto). Capabilities like COMMANDLOG and SLOT-STATS are detected per version, and the UI gracefully degrades when a feature isn't available.
Managed services are supported too - guides for AWS ElastiCache, MemoryDB, Redis Cloud, and Upstash live in docs/providers, and @betterdb/agent reaches VPC-only instances over an outbound WebSocket.
The Docker image contains the monitoring application (backend + frontend). It requires:
docker run -d \
--name betterdb-monitor \
-p 3001:3001 \
-e DB_HOST=your-valkey-host \
-e DB_PORT=6379 \
-e DB_PASSWORD=your-password \
-e STORAGE_TYPE=postgres \
-e STORAGE_URL=postgresql://user:pass@postgres-host:5432/dbname \
betterdb/monitor
Set the PORT environment variable and match the -p mapping:
docker run -d \
--name betterdb-monitor \
-p 8080:8080 \
-e PORT=8080 \
-e DB_HOST=your-valkey-host \
betterdb/monitor
If your Valkey and PostgreSQL are running on the same host:
docker run -d \
--name betterdb-monitor \
--network host \
-e DB_HOST=localhost \
-e DB_PORT=6380 \
-e DB_PASSWORD=devpassword \
-e STORAGE_TYPE=postgres \
-e STORAGE_URL=postgresql://dev:devpass@localhost:5432/postgres \
betterdb/monitor
Full reference, including AI, OTLP export, webhook tuning, and health-gate thresholds: docs/configuration.md.
BetterDB Monitor unlocks Pro/Enterprise features in one of two ways, depending on whether the host has internet access:
BETTERDB_LICENSE_KEY. The monitor validates it
against betterdb.com and caches a locally-verified signed token, so your
tier keeps working through short outages and restarts.Every entitlement is a signed RS256 JWT. The monitor verifies it locally against public keys embedded in the image - it never has to reach a license server to trust a token. So an air-gapped host can run paid tiers with zero connectivity:
.jwt, Pro/Enterprise). It contains no
secrets and can't be tampered with - any edit breaks the signature.BETTERDB_OFFLINE_LICENSE_FILE (path), BETTERDB_OFFLINE_LICENSE
(inline string), or paste it in the UI under Settings → License → "Air-gapped
environment? Activate an offline license."When an offline token is configured and no BETTERDB_LICENSE_KEY is set, the
monitor makes zero outbound requests - license checks, telemetry, and update
pings are all disabled. It runs the granted tier until the token expires (perpetual
licenses re-download yearly), then reverts to Community.
# fully offline - no network required
docker volume create betterdb-data
docker run --rm -v betterdb-data:/d alpine chown 1001:1001 /d # volume writable by UID 1001 (one-time)
docker run -d --name betterdb-monitor -p 3001:3001 \
-e DB_HOST=your-valkey-host -e DB_PORT=6379 -e DB_PASSWORD=your-password \
-v /path/to/betterdb-license.jwt:/run/secrets/betterdb-license.jwt:ro \
-e BETTERDB_OFFLINE_LICENSE_FILE=/run/secrets/betterdb-license.jwt \
-v betterdb-data:/app/data \
betterdb/monitor
Verify with GET /api/license/status → source: offline-token, mode: offline,
airGapped: true.
Persistence: mount a writable volume at
/app/dataso the offline license and the online outage-grace token survive restarts. The container runs as UID 1001, so a freshly-created volume must bechowned to it (shown above) - otherwise persistence fails withEACCES … license.jwt.
For the full flow, verification precedence, and key-rotation runbook see Offline & Air-Gapped Licenses and the Configuration reference.
node:20-alpinelatest / -no-ai) / ~640MB (versioned image with the experimental AI Helper's local-LLM dependencies)linux/amd64, linux/arm64docker logs -f betterdb-monitor # follow logs
docker stop betterdb-monitor # stop
docker rm betterdb-monitor # remove
BetterDB Monitor persists audit trail, analytics, captures, and anomaly data to one of three backends:
Metrics are exposed at GET /api/prometheus/metrics in Prometheus text format: ACL audit, client connections, slowlog/commandlog patterns, memory, throughput, keyspace, replication, cluster slot stats, and Node.js runtime metrics - all prefixed betterdb_.
scrape_configs:
- job_name: 'betterdb-monitor'
metrics_path: '/api/prometheus/metrics'
static_configs:
- targets: ['your-monitor-host:3001']
Full metric reference: docs/prometheus-metrics.md and docs/prometheus-integration.md.
betterdb-monitor/
├── apps/
│ ├── api/ # NestJS backend (Fastify)
│ └── web/ # React frontend (Vite)
├── packages/ # Published packages (see below)
├── docs/ # Documentation site (Jekyll)
├── docker-compose.yml # Local Valkey (port 6380) and Redis (port 6382) for testing
└── package.json # Workspace root
This monorepo ships several standalone packages. See packages/ for the full list.
iovalkey for Valkey/Redis connections, TypeScript strict mode. Port 3001.Prerequisites: Node.js >= 20.0.0, pnpm >= 9.0.0, Docker.
pnpm install
cp .env.example .env
pnpm docker:dev # local Valkey (6380) and Redis (6382)
pnpm dev # web on :5173, api on :3001
To connect to Redis instead of Valkey, set DB_PORT=6382 in .env.
pnpm dev:api # API only
pnpm dev:web # frontend only
pnpm docker:dev:down # stop local databases
pnpm build # production build
pnpm test # API tests
Docker image builds:
pnpm docker:build # local build
pnpm docker:publish # multi-arch build & push (requires buildx)
apps/api/src/apps/web/src/api/packages/shared/src/types/anydocs/ is licensed under CC BY-SA 4.0.proprietary/ is covered by a commercial license (see proprietary/LICENSE). These features are free during early access.| Interface | Details |
|---|
| Web UI | http://localhost:3001 |
| MCP server | npx @betterdb/mcp (stdio) - create a token under Settings → MCP Tokens |
| Prometheus | http://localhost:3001/api/prometheus/metrics |
| REST API (OpenAPI) | http://localhost:3001/docs |
| Health check | http://localhost:3001/api/health |
| Variable | Required | Default | Description |
|---|
DB_HOST | Yes | localhost | Valkey/Redis host to monitor |
DB_PORT | No | 6379 | Valkey/Redis port |
DB_PASSWORD | No | - | Valkey/Redis password |
DB_USERNAME | No | default | Valkey/Redis ACL username |
DB_TYPE | No | auto | Database type: auto, valkey, or redis |
STORAGE_TYPE | No | memory | Storage backend: memory or postgres |
STORAGE_URL | Conditional | - | PostgreSQL connection URL (required if STORAGE_TYPE=postgres) |
PORT | No | 3001 | Application HTTP port |
NODE_ENV | No | production | Node environment |
ANOMALY_DETECTION_ENABLED | No | true | Enable anomaly detection |
ANOMALY_PROMETHEUS_INTERVAL_MS | No | 30000 | Prometheus summary update interval (ms) |
BETTERDB_LICENSE_KEY | No | - | Online license key (Pro/Enterprise), validated over the network |
BETTERDB_OFFLINE_LICENSE_FILE | No | - | Path to a signed offline license .jwt for air-gapped hosts (see below) |
BETTERDB_OFFLINE_LICENSE | No | - | Offline license token as an inline JWT string |
BETTERDB_DATA_DIR | No | /app/data | Directory for persisted license state (mount a writable volume) |
BETTERDB_TELEMETRY | No | true | Set false to disable anonymous telemetry |
| Backend | Use case | Notes |
|---|
memory | Testing, ephemeral environments | Default in Docker; all data lost on restart |
postgres | Production | STORAGE_TYPE=postgres + STORAGE_URL=postgresql://user:pass@host:port/db |
sqlite | Local development / CLI | Not included in Docker production images; STORAGE_SQLITE_FILEPATH optional |
| Package | Language | Registry |
|---|
@betterdb/monitor | TypeScript | npm |
@betterdb/mcp | TypeScript | npm |
@betterdb/agent | TypeScript | npm |
@betterdb/semantic-cache | TypeScript | npm |
betterdb-semantic-cache | Python | PyPI |
@betterdb/agent-cache | TypeScript | npm |
betterdb-agent-cache | Python | PyPI |
cache-benchmark | Python | Replay harness for benchmarking semantic caches |