 airbus-cert/ttddbg
Time Travel Debugging IDA plugin

⚠️ Attention IDA 8 users: using ttddbg with IDA 8 require a work-around for the moment, see Known issues
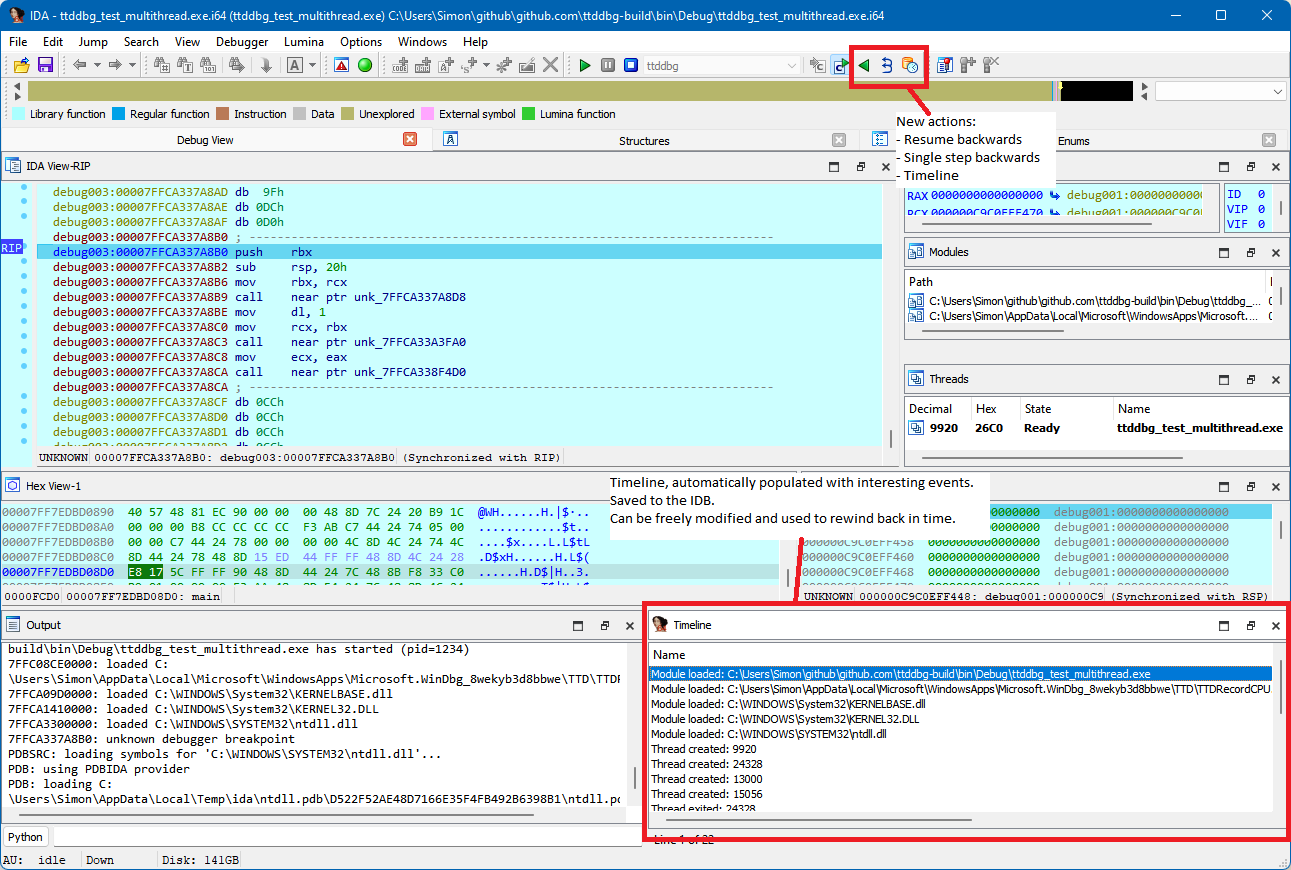
This plugin adds a new debugger to IDA which supports loading Time Travel Debugging traces generated using WinDBG Preview.
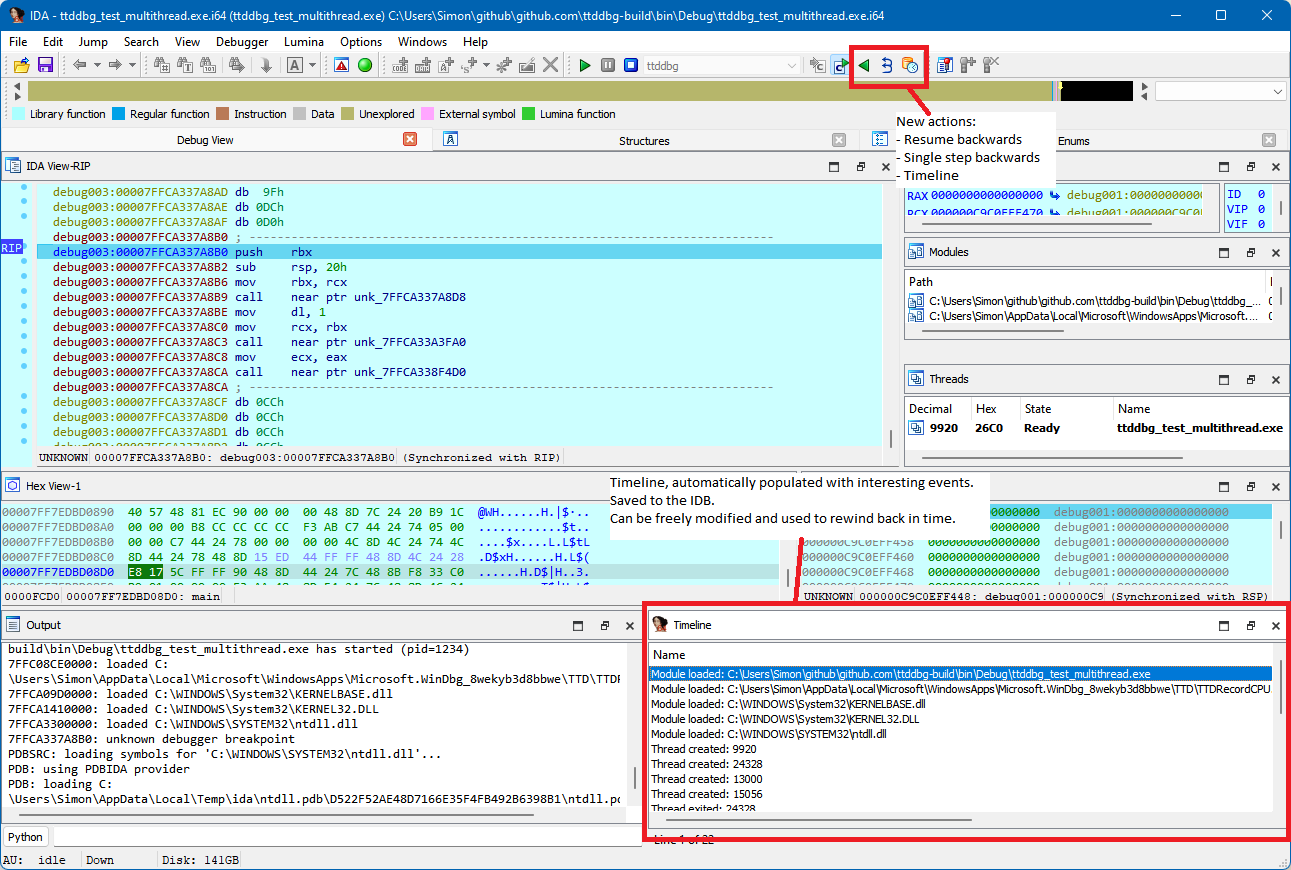
This plugin supports both x86 and x64 traces, and by extension IDA and IDA64.
Installing the plugin can be done using the installer from the releases page. The installer will automatically install the required dependencies, provided you have a copy of WinDBG Preview installed.
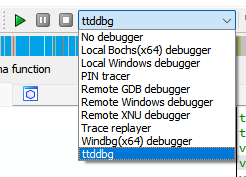
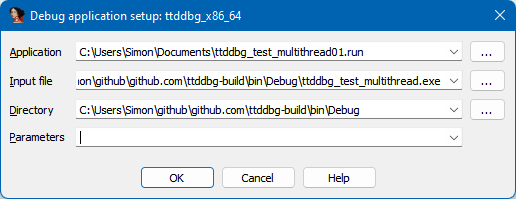
Once installed, you can use the plugin by selecting the ttddbg debugger in the IDA interface, and specifying your *.run file as the "Application". For help on generating a .run file, see HOWTO_TIME_TRAVEL.md.
| Icon | Action |
|---|---|
 | Go to previous breakpoint |
 | Simulate a full run of the program |
 | Single step backward (RIP - one instruction) |
 | Manage the timeline of interesting events (Threads Created/Terminated, Module Loaded/Unloaded, Exceptions, Custom) |
 | Manage the currently traced functions |
 | View trace events |
Since version 1.1.0, ttddbg supports a new feature we call "function tracing". While in the debugging view, it is possible to mark functions for tracing by right-clicking them in the Functions or Module interfaces. Once a function is traced, any call to this function, and any return statement, will be recorded in the new Trace events window.
Using the function information from your reverse engineering work, ttddbg also extracts the parameters passed to the function as well as its return value. Symbols are automatically pretty-printed based on the information available to IDA, such as enum values.
picture_search plugin, which is new in IDA 8. Removing picture_search.dll and picture_search64.dll from the plugins folder temporarily fixes this issue. The problem has been raised to Hex-Rays.Prerequisites:
TTDReplay.dll (usually in C:\Program Files\WindowsApps\[WinDBG folder]\amd64\ttd\)TTDReplayCPU.dll (usually in C:\Program Files\WindowsApps\[WinDBG folder]\amd64\ttd\)And let CMAKE do its magic!
$ git clone [email protected]:airbus-cert/ttddbg.git --recursive
$ mkdir build
$ cd build
$ cmake ..\ttddbg -DIDA_SDK_SOURCE_DIR=[PATH_TO_IDA_SDK_ROOT_FOLDER] -DCPACK_PACKAGE_INSTALL_DIRECTORY="IDA Pro 7.7"
$ cmake --build . --target package --config release
To create a dev solution:
$ git clone [email protected]:airbus-cert/ttddbg.git --recursive
$ mkdir build
$ cd build
$ cmake ..\ttddbg -DIDA_SDK_SOURCE_DIR=[PATH_TO_IDA_SDK_ROOT_FOLDER] -DBUILD_TESTS=ON
Greetz to commial for his work on ttd-bindings!
