
GPEWebDefender — Updated!
Lightweight web-attack monitor. One Go binary + SQLite. Not OSSEC, not a WAF.
GPEWebDefender
A web-attack monitor. It sits next to nginx / Caddy / the app, tails access logs, and tells you when a site is being probed or exploited. If this process dies, the site keeps serving.
It is not Wazuh, not OSSEC, and not a WAF.
The command is gpewebdefender. Hosts, tokens, map pins, GeoIP, and log paths are flags or env files — nothing about a specific company or server is compiled in.
If you have never run this: read this file top to bottom once, then do Method A or Method B. Do not skip “Pick a shape.”
Full picture: dochub/index.html or /docs/ on a running manager. Start at 03 · Install & run.
What it looks like
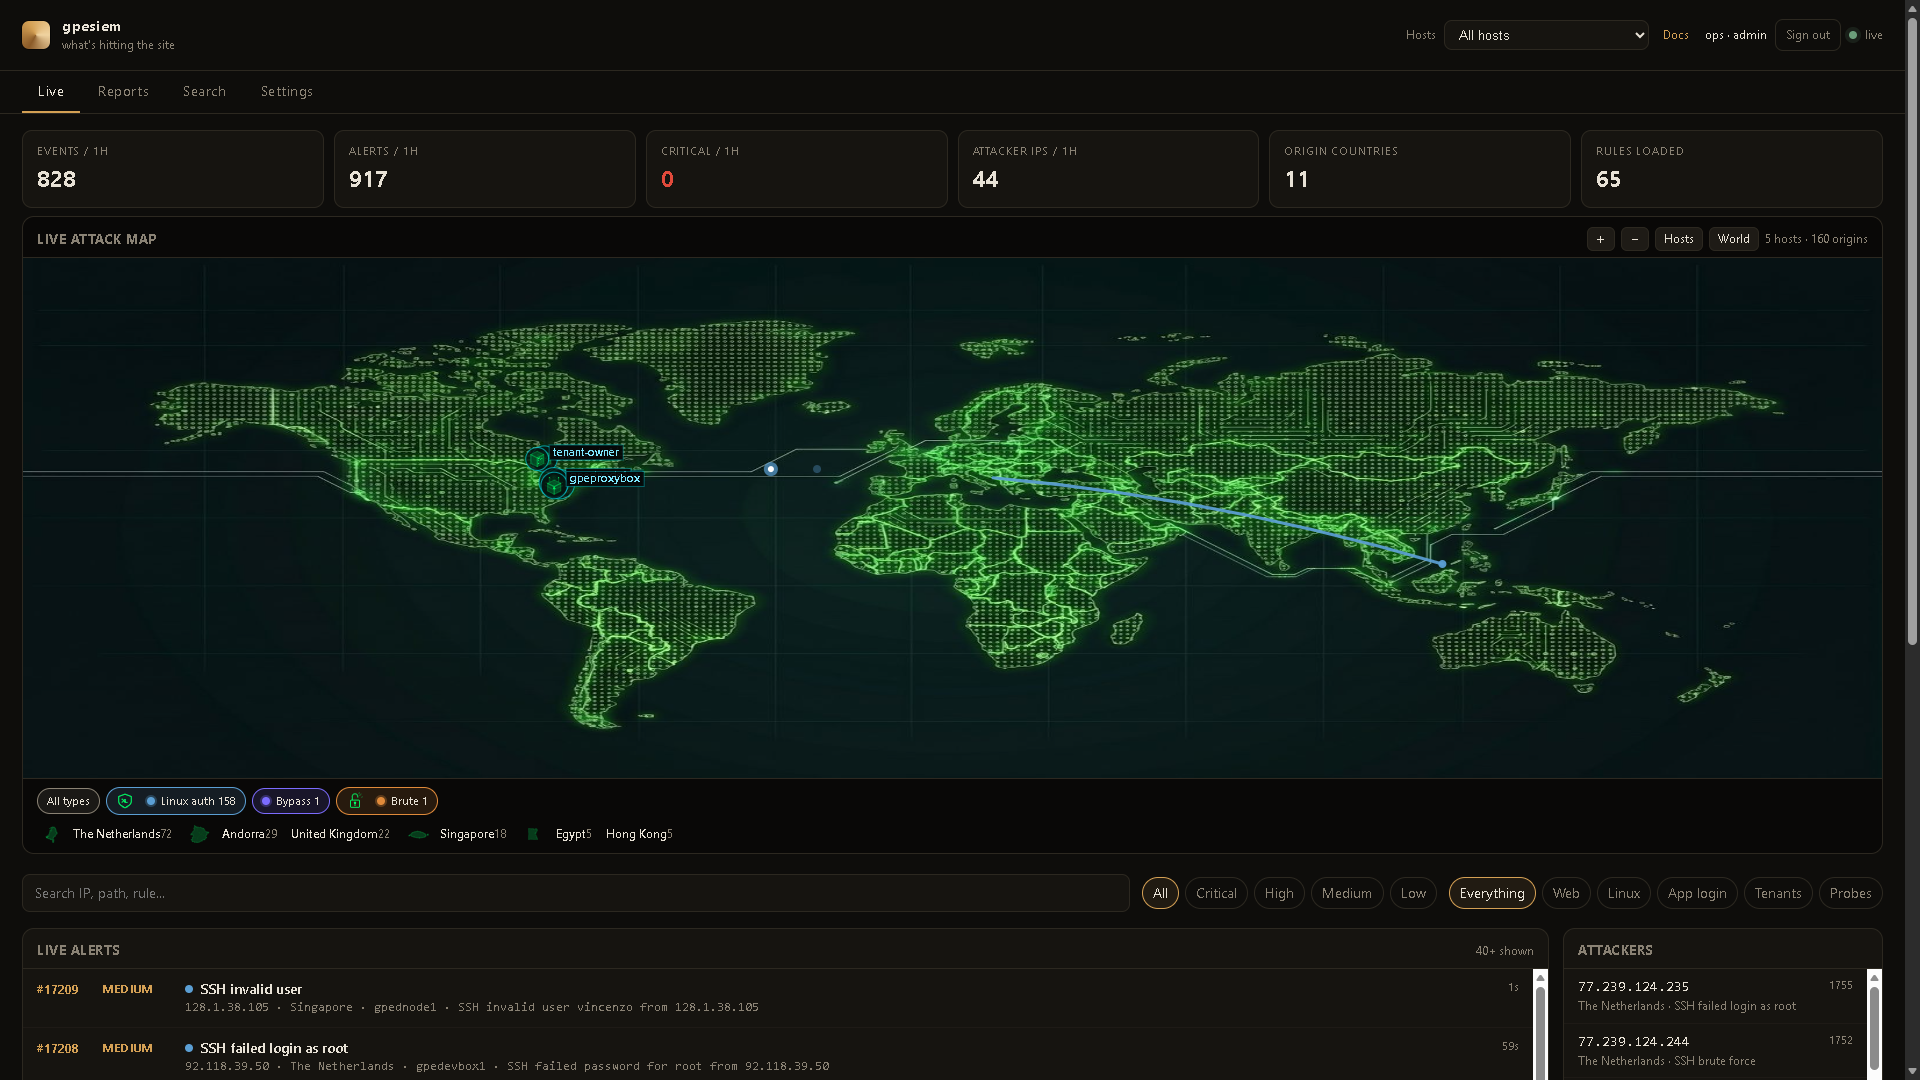
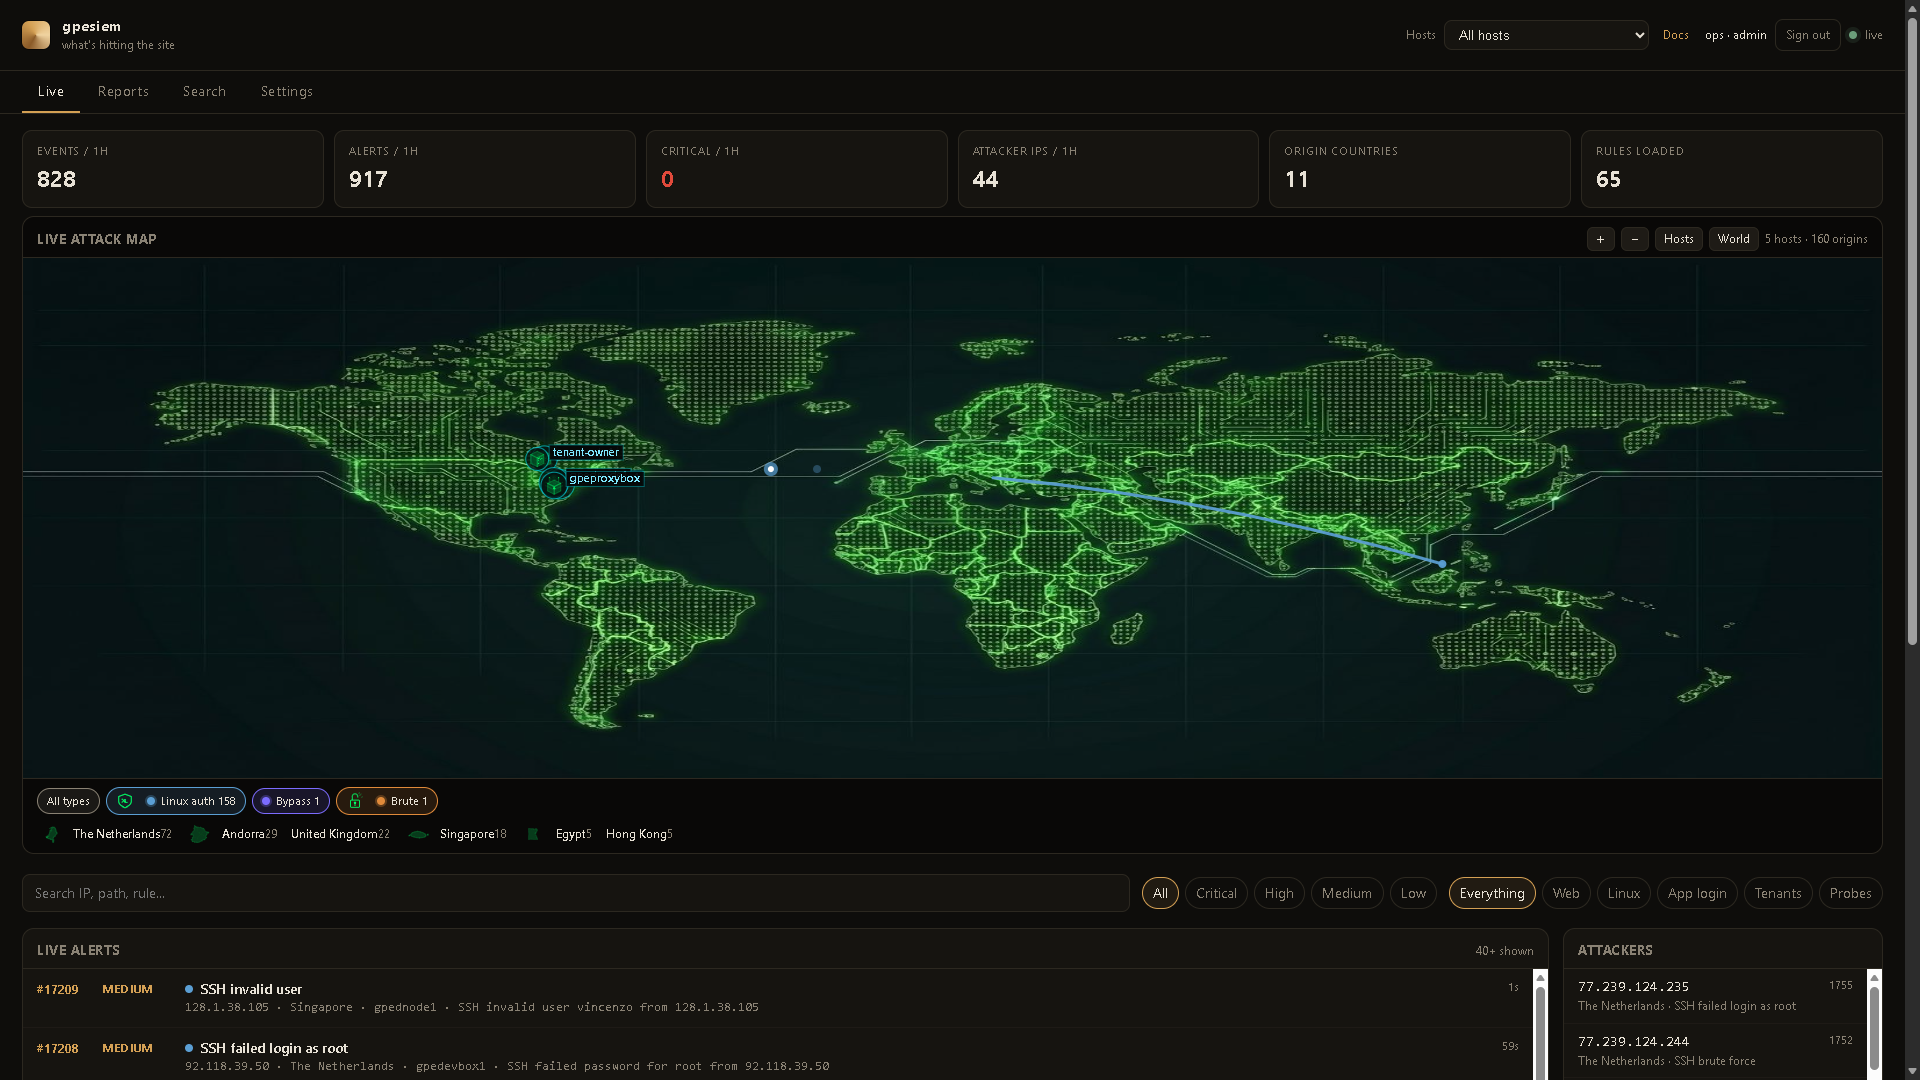
Live dashboard from a real operator box. Your names and pins will be whatever you configure.
Live map
A shot fires only when an alert happens — attacker country to the host that was hit — then it goes away. Hosts stay on the plate. The feed is the same events, numbered.
Alert card
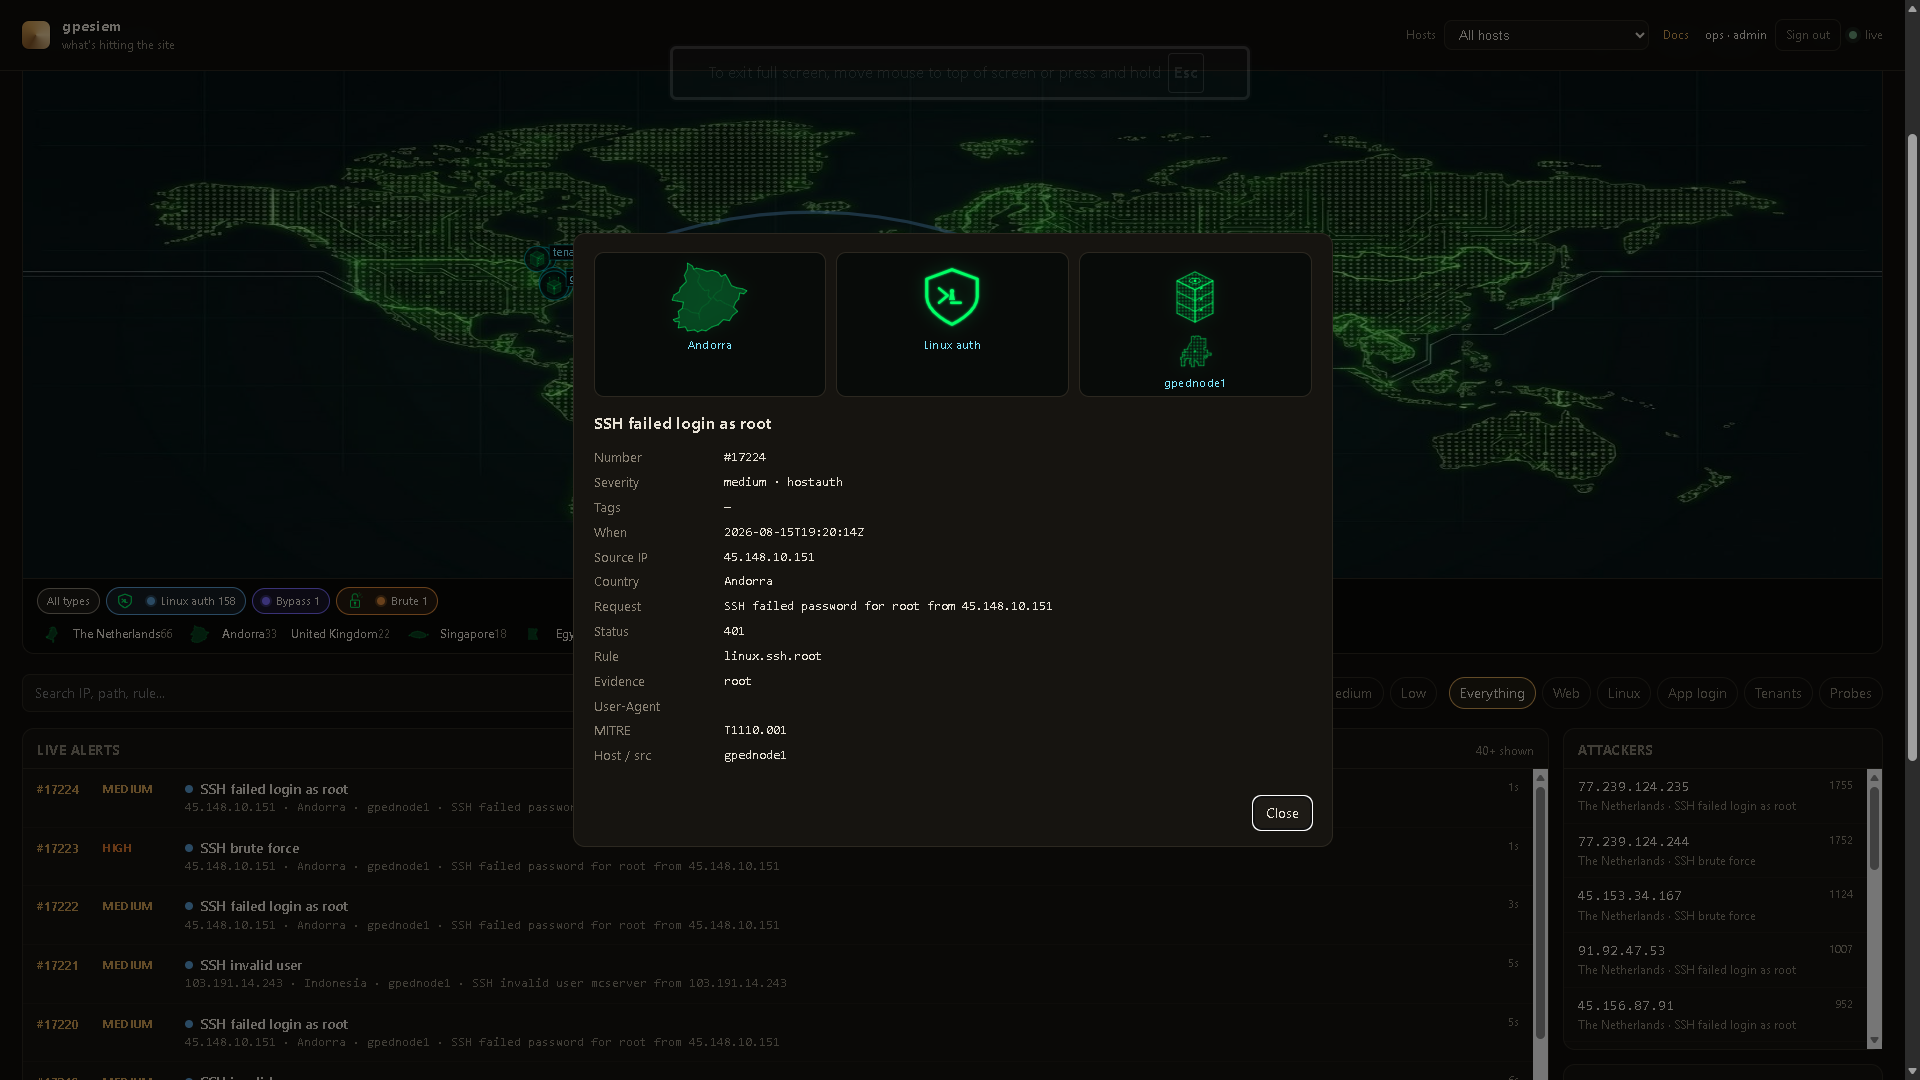
Click a row. Country plate, attack-type mark, and the server that was hit, plus the usual fields (rule, MITRE, evidence). No standing tracks.
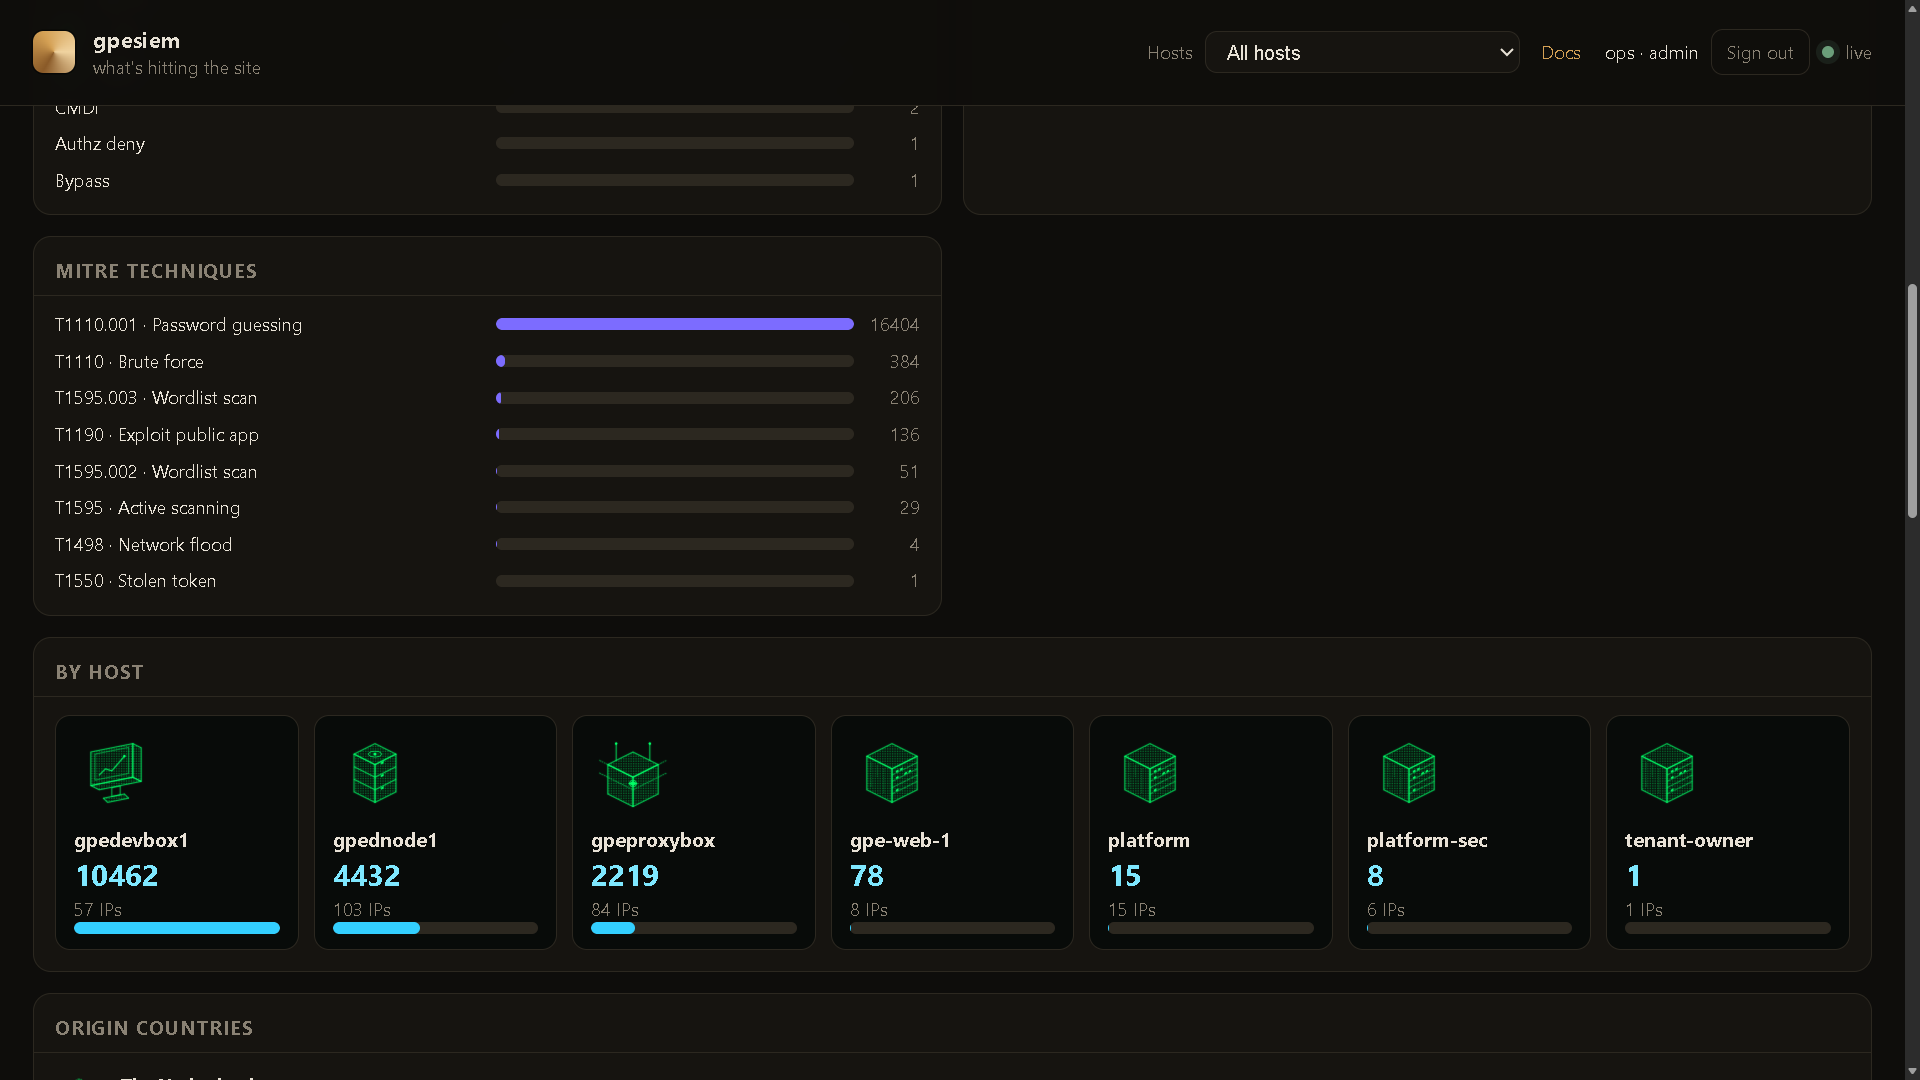
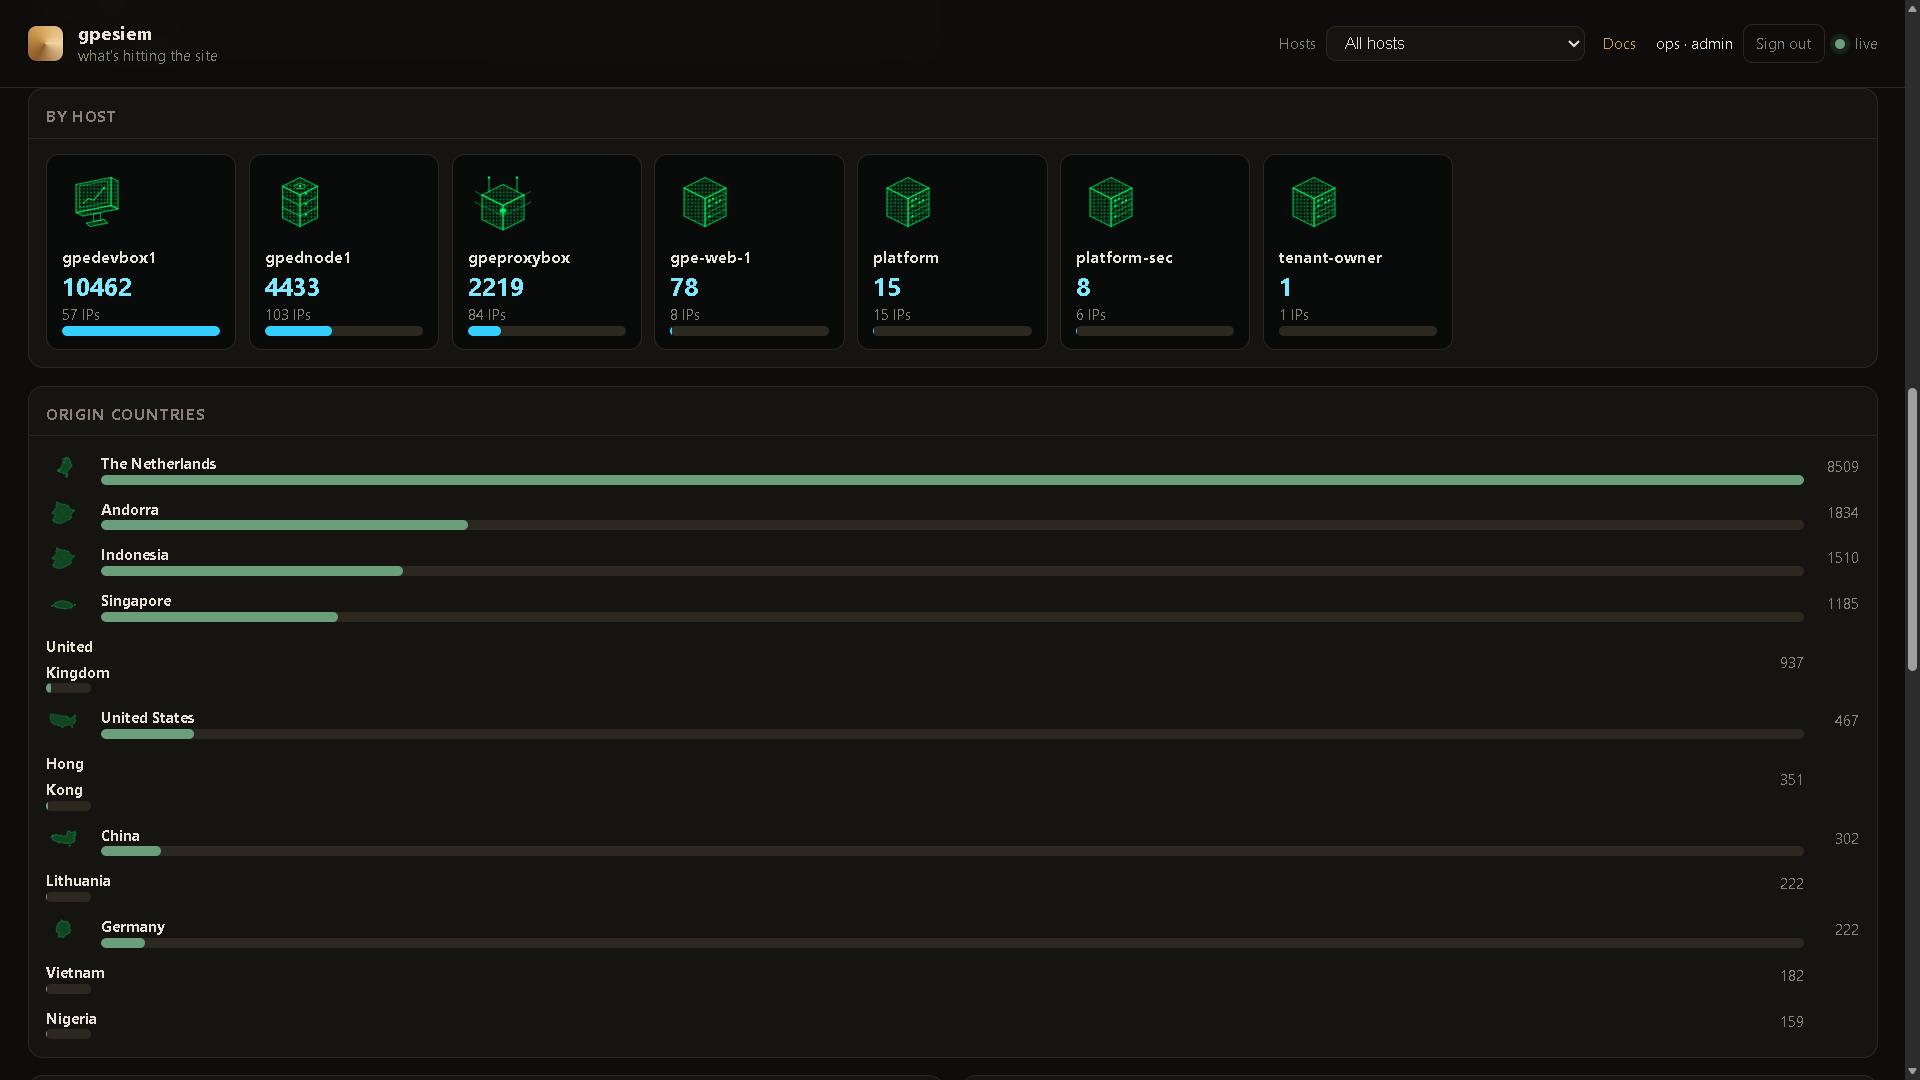
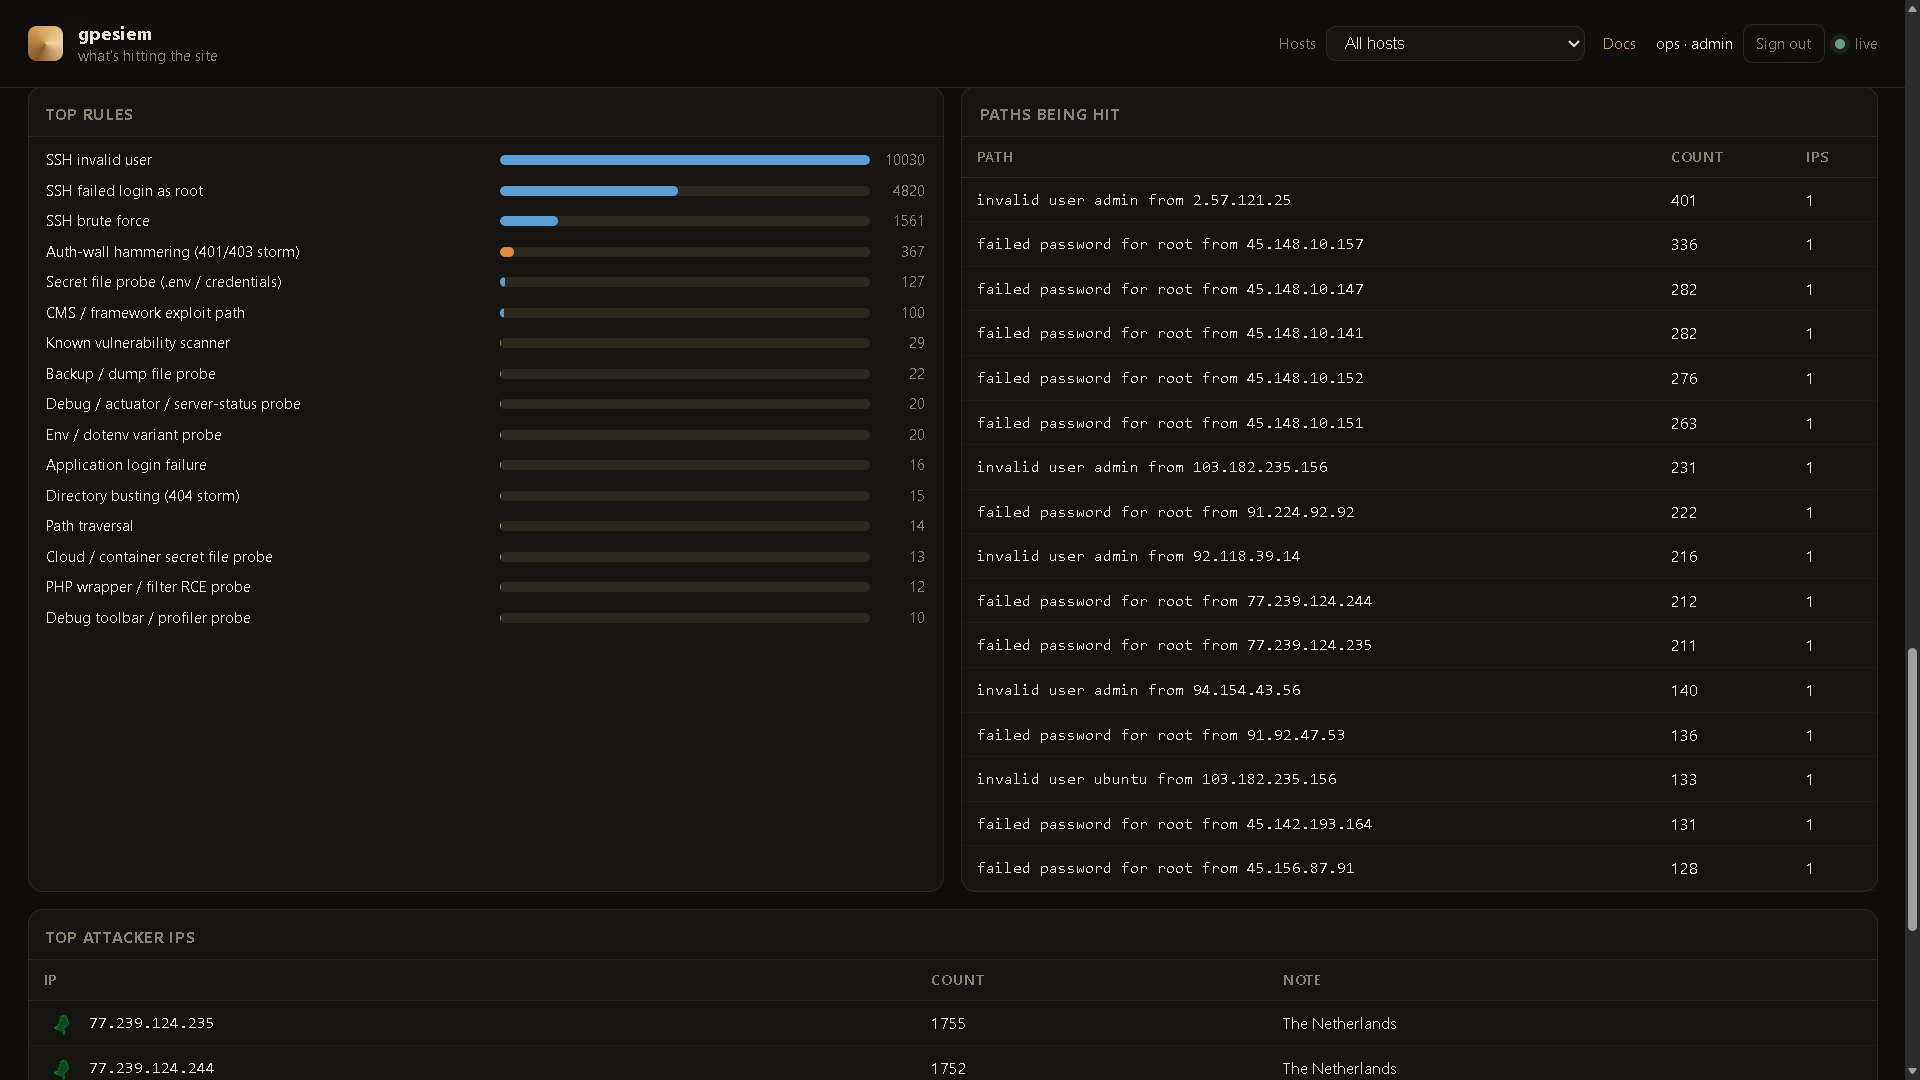
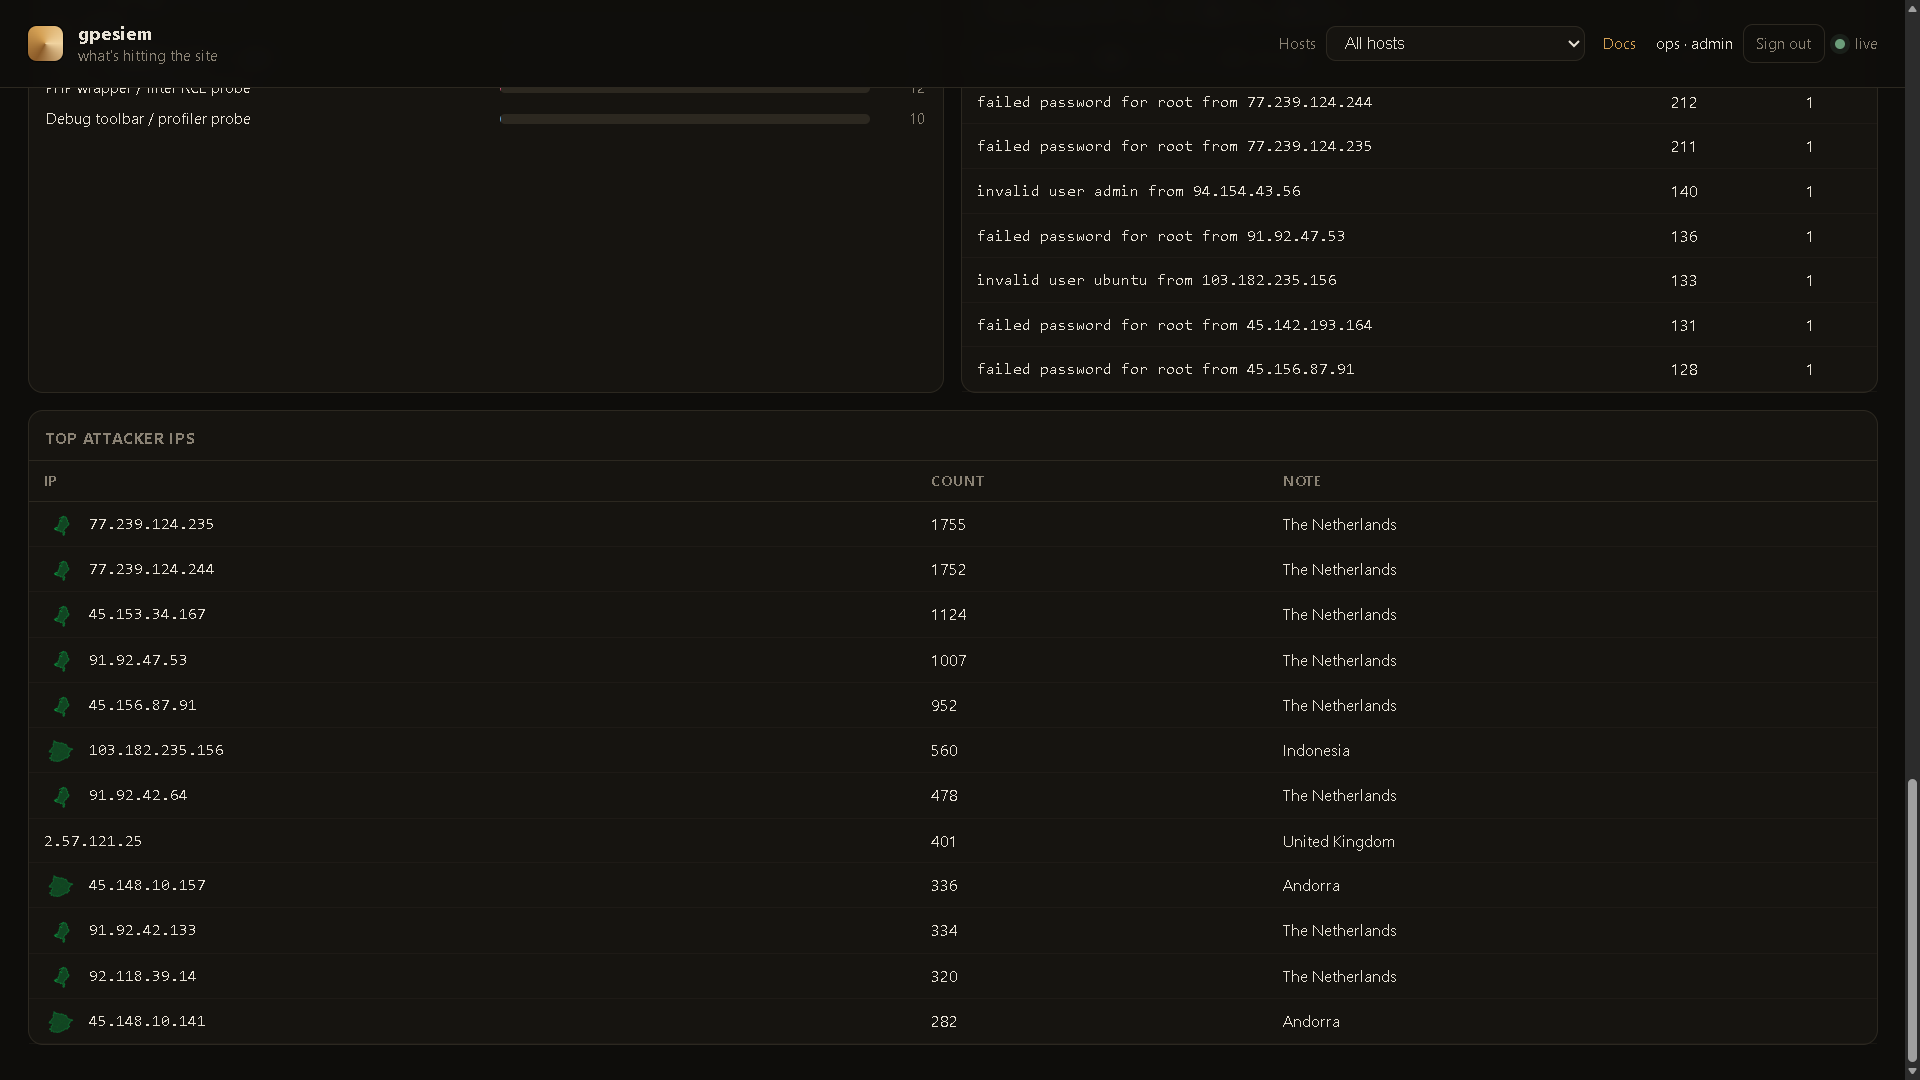
Insight
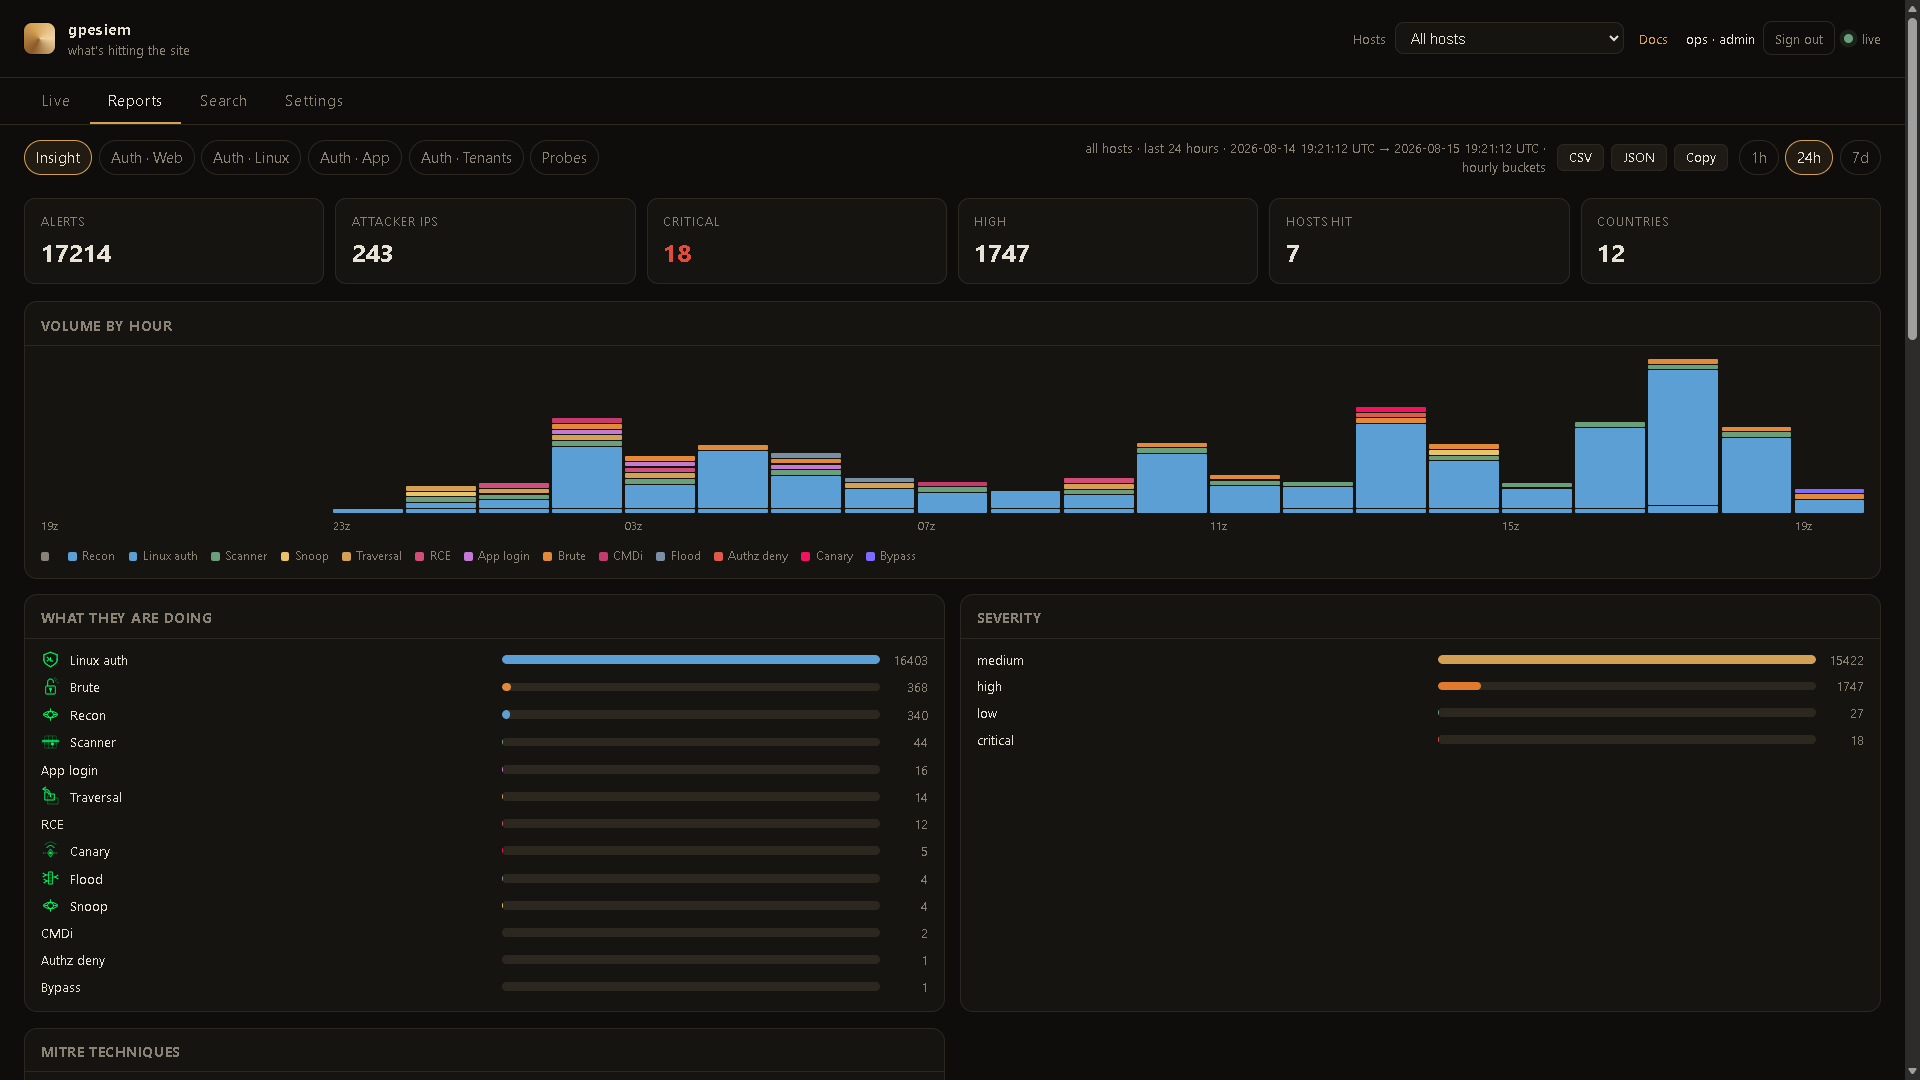
Reports → Insight. Same alerts, broken down. 1h / 24h / 7d is a real clock. Click a bar or host card to Search. CSV / JSON / Copy export that window (session cookie, no ingest token in the file).
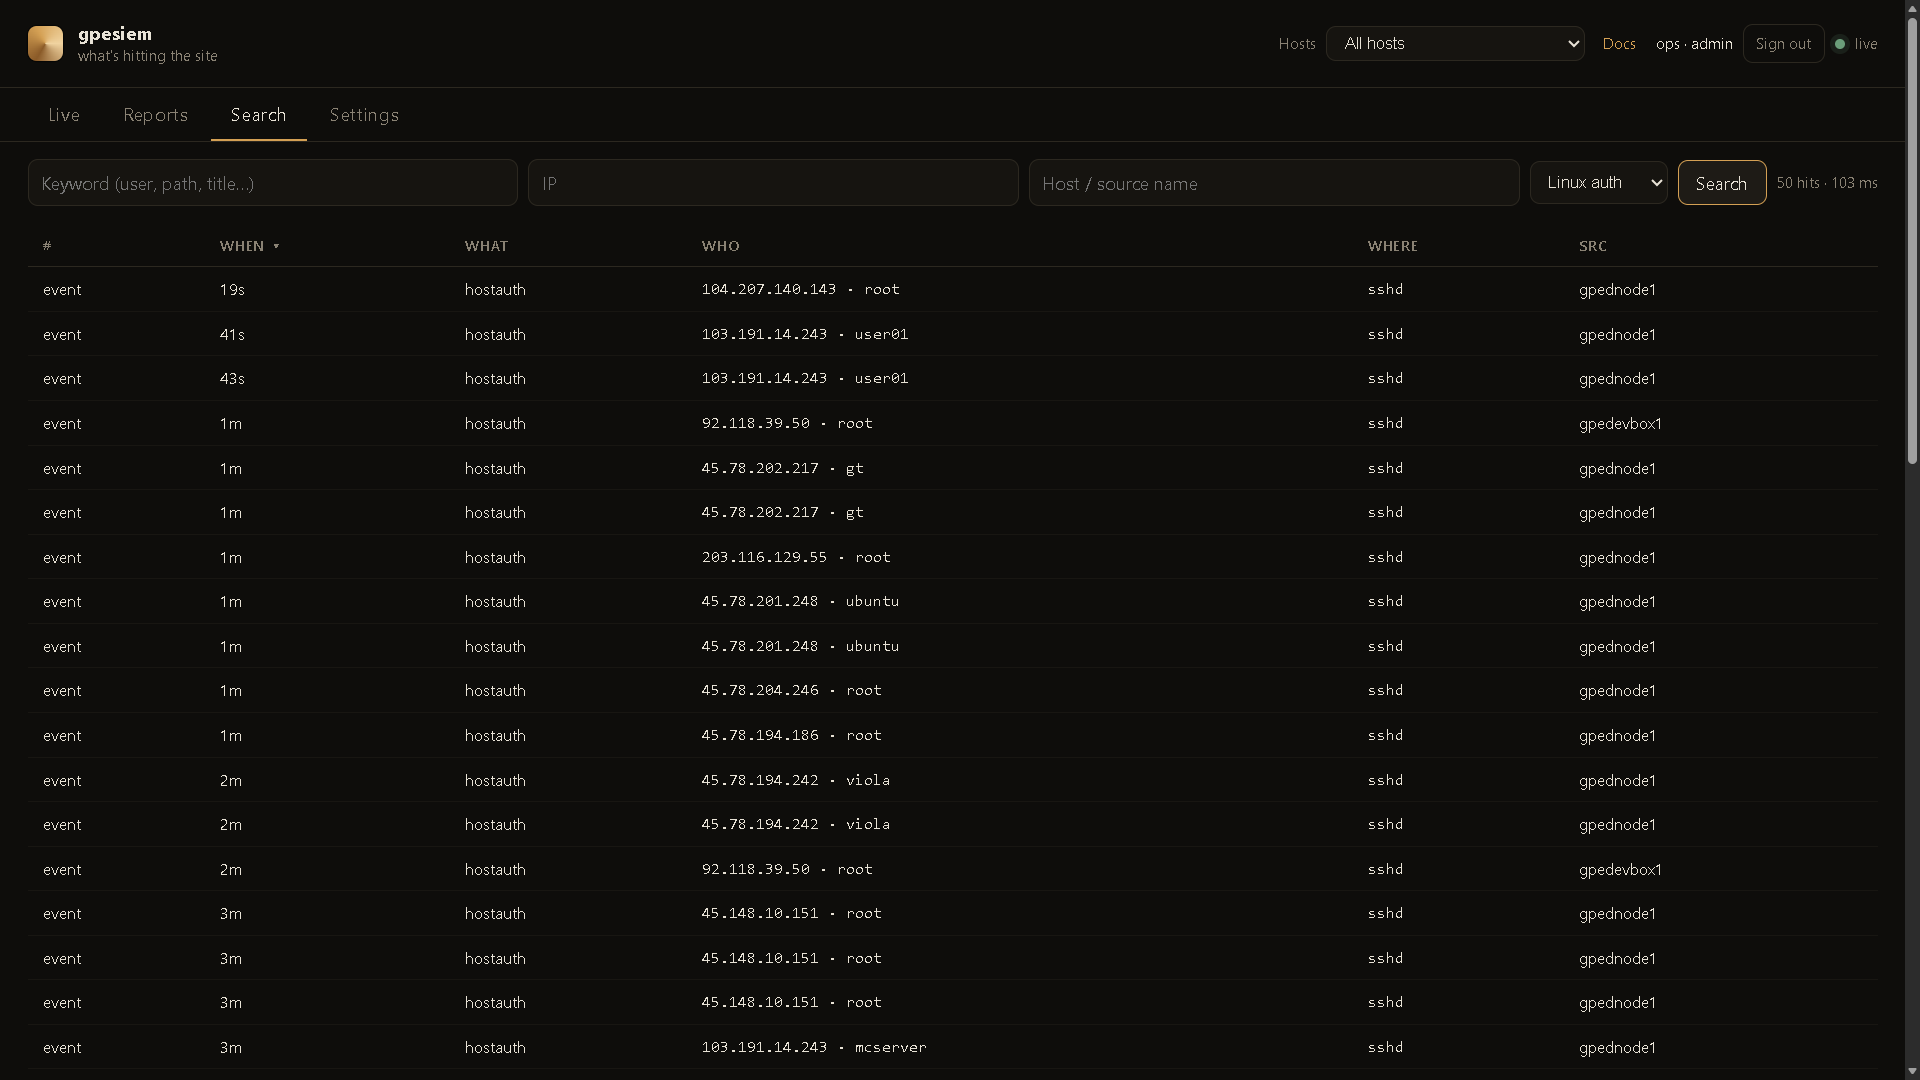
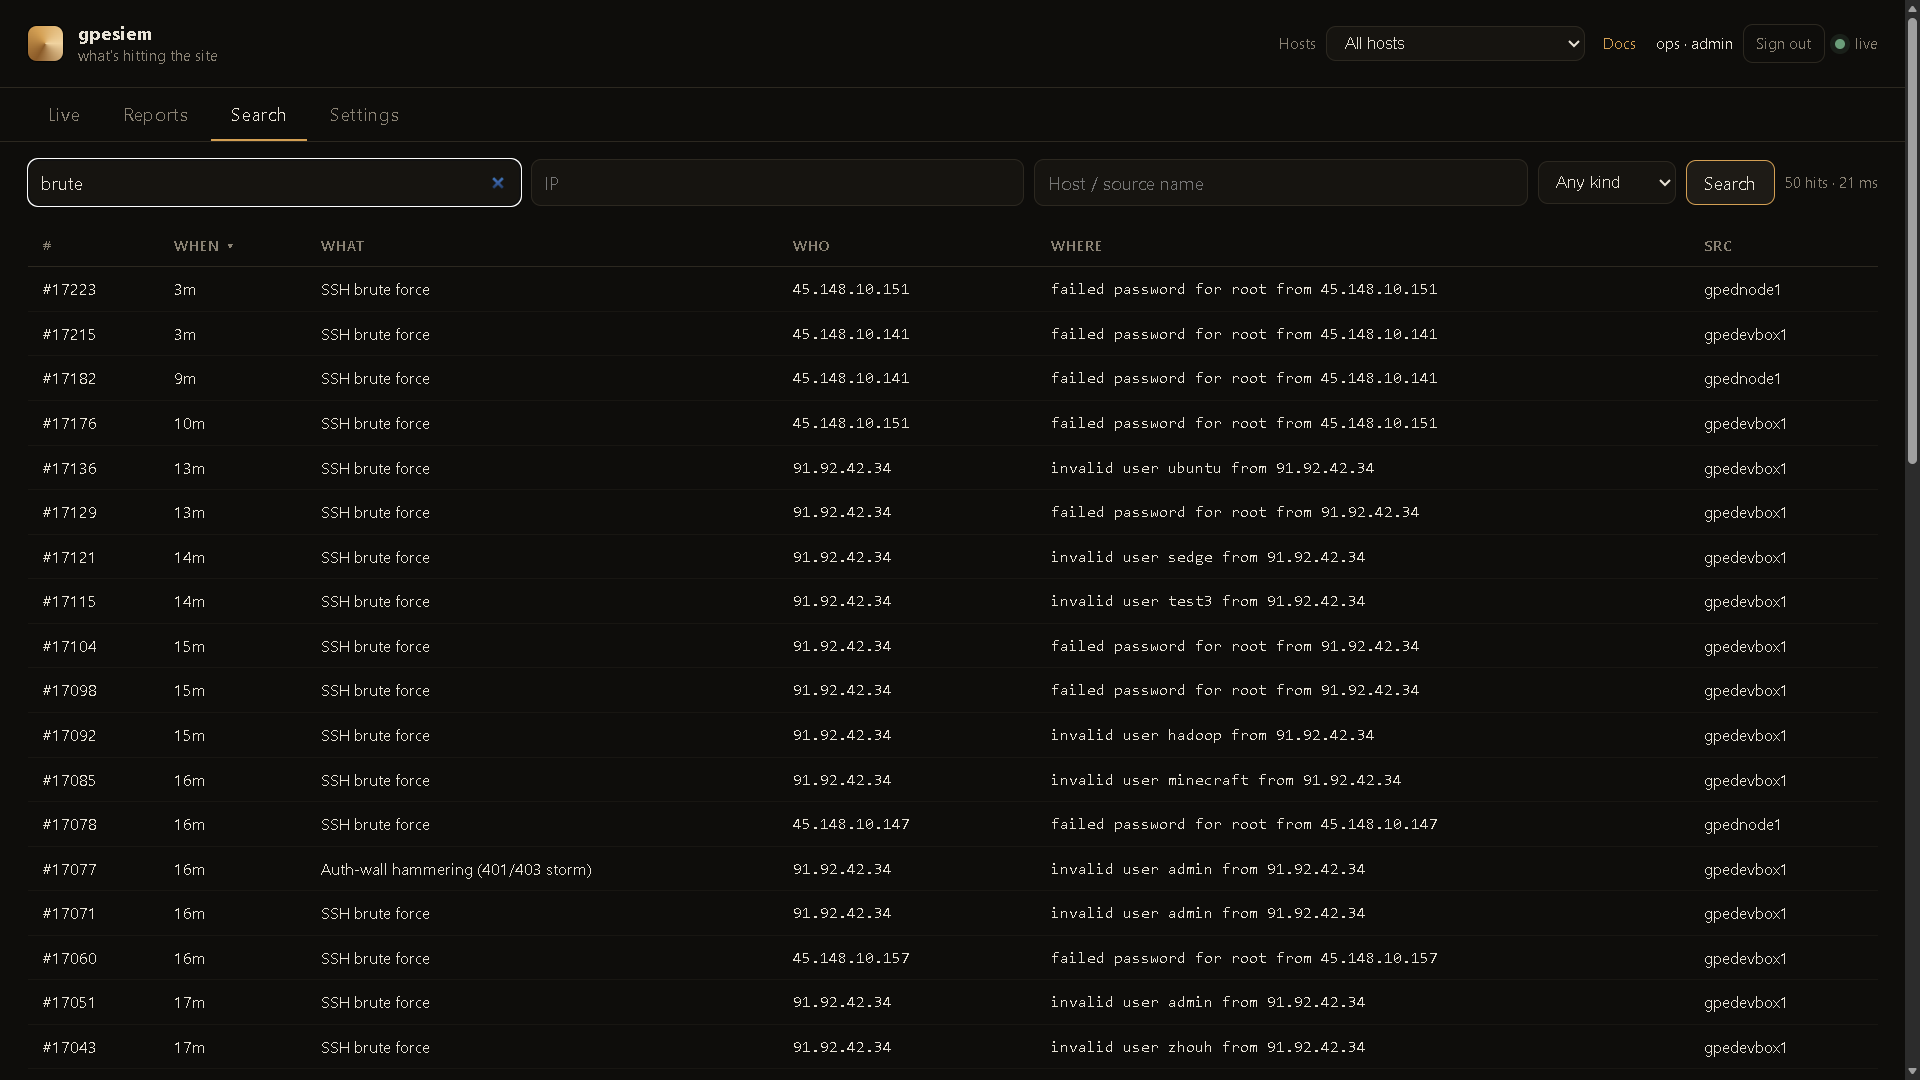
Search
FTS5 on the manager. Keyword, IP, host, kind. Newest first (click When to flip). No Elasticsearch.
Status
Status is on demand. Click Check now (or Check all paired hosts) when you want load, memory, and disk. The manager answers immediately. A paired sensor answers on its next command poll (a few seconds). Charts are the snapshots you asked for — nothing is scraped in the background. Pairing is the same flow as block (DocHub 20 / 21).
Pick a shape
| You have | Install |
|---|---|
| A laptop and curiosity | gpewebdefender demo — fake attacks, not your site |
| One Linux box that already writes an access log | All-in-one — manager tails that log. No agent. |
| A small extra box + one or more web servers | Split — manager on the extra box, one agent per web (or SSH) host |
Do not open port 8787 to the internet. Default listen is 127.0.0.1:8787. Use an SSH tunnel until you put HTTPS + a login in front.
Look first (any OS)
go build -o gpewebdefender.exe .\cmd\gpewebdefender
gpewebdefender.exe demo
Linux:
go build -o gpewebdefender ./cmd/gpewebdefender
./gpewebdefender demo
Open http://127.0.0.1:8787
Those map shots are invented. See DocHub 04 before you treat a dashboard as reality.
Method A — the script (Linux + systemd)
From this repo, as root. Build a Linux binary first if you are on Windows:
$env:GOOS="linux"; $env:GOARCH="amd64"; $env:CGO_ENABLED="0"
go build -o gpewebdefender-linux-amd64 .\cmd\gpewebdefender
All-in-one (this box has the access log):
chmod +x deploy/install-manager.sh deploy/install-agent.sh
sudo ./deploy/install-manager.sh --all-in-one \
  --tail /var/log/nginx/access.log \
  --journal \
  --home 40.7,-74.0
Split (monitor first, then each web box):
# on the monitor
sudo ./deploy/install-manager.sh --home 40.7,-74.0

# on a web / SSH box
scp root@MONITOR:/usr/local/bin/gpewebdefender /usr/local/bin/gpewebdefender
scp root@MONITOR:/etc/gpewebdefender/env /etc/gpewebdefender/env
sudo ./deploy/install-agent.sh \
  --url http://MONITOR:8787 \
  --name web-1 \
  --tail /var/log/nginx/access.log \
  --journal
Replace MONITOR, web-1, and the log path with your values.
Optional later — that host can take block orders: Settings → Paired hosts → phrase + code, then add --code ABCD-2341 --block fail2ban to install-agent.sh. DocHub 20.
Then from your laptop:
ssh -L 8787:127.0.0.1:8787 user@THEBOX
Open http://127.0.0.1:8787/login and create the first admin (a person). That is not the ingest token.
Method B — you type every file
- Copy the binary to
/usr/local/bin/gpewebdefenderandchmod +x. useradd --system --home /var/lib/gpewebdefender --shell /usr/sbin/nologin gpewebdefender- Copy
rules/anddochub/into/var/lib/gpewebdefender/. - Copy
deploy/env.exampleto/etc/gpewebdefender/env. Put a long randomGWD_TOKEN. Mode640. - Copy
deploy/gpewebdefender.service.exampleto systemd. Edit home / tail if needed. systemctl daemon-reload && systemctl enable --now gpewebdefender- Other hosts:
deploy/gpewebdefender-agent.service.examplewith the same token, a stable--name, and--tail/--journal.
Examples live in deploy/.
After it is up (do these in order)
- Tunnel +
/login→ first admin. Or setSIEM_ADMIN_USER+SIEM_ADMIN_PASSWORDonce, then delete the password line. - Settings → name the dashboard, pin the site (
USor40.7,-74.0), one row per agent--name. - Live — shots fire only when an alert happens, then they go away.
- Reports → Insight — 1h / 24h / 7d is a real clock. Click a bar to Search. CSV / JSON export is that same window (session cookie, no token in the file).
- Optional GeoIP: drop a MaxMind / DB-IP
.mmdband pass--geoip. - Optional HTTPS:
deploy/nginx-gwd.conf.example. Deny/api/ingeston the public vhost. DocHub 15 and 18. - Optional app denials the access log cannot see: POST JSON to
/api/ingest. Never send passwords. DocHub 19. - Optional block from the dashboard: Settings → Paired hosts → invent a phrase → mint a code → on the sensor
gpewebdefender pair --url … --name web-1 --code … --block fail2ban→ Approve. DocHub 20. Viewer and the ingest token cannot ban. Not automatic. - Optional Status: open Status and click Check on the manager (works immediately). Pair a host (same as step 8) to Check that box for load / memory / disk. Nothing is polled until you click. Agents need 0.9.25+. DocHub 21.
- Protect the site (DocHub 22): plant
/.well-known/siem-canary, confirmGET /@vite/clientis not 200 on the public host, POSTkind=secprobefor IDOR / webhooks / score abuse the access log cannot see. Never send passwords.
If the UI is empty: you are not in demo, and no --tail / agent has sent a line yet. journalctl -u gpewebdefender -n 50.
What it watches
Anything that shows up in an access log:
- SQL injection, XSS, path traversal, command injection, SSTI, PHP wrappers
- Log4Shell / Spring4Shell / cloud-metadata SSRF in the URL or UA
- Secret-file and admin hunting (
.env,.git, phpMyAdmin, wp-login, actuators) - Known scanners (sqlmap, nuclei, nikto, ffuf, …)
- 404 storms, 401/403 hammering, login brute force, request floods
- Optional: sshd / sudo via
--journalorauth.log - Front-end leak:
/@vite,/@fs,/src/main.jsx, served.js.map(a 200 is a leak) - Optional: your app POSTs
kind=applogin/tenantlogin/secprobe(IDOR, canary, webhook, score abuse, …). DocHub 19 / 22.
It cannot see POST bodies unless you log them (you usually should not).
Log formats
nginx / Apache combined, or nginx / Caddy / Traefik JSON. JSON is worth switching to. See DocHub 05.
Rules
Built-in YAML in rules/. Extra files: --rules path/to/more.yaml. Optional CMS honey: --rules packs (loads packs/cms.yaml). Not a plugin scanner.
Resource target
One static Go binary + SQLite. A dedicated 2 CPU / 2 GB box is plenty. No JVM, no OpenSearch, no Elasticsearch.
Publish / build
This tree is the public product. It has no inventory, tokens, or hostnames.
go test ./...
set GOOS=linux
set GOARCH=amd64
set CGO_ENABLED=0
go build -o gpewebdefender-linux-amd64 .\cmd\gpewebdefender
Keep live fleet config out of this repository.