 ddudle/ctxdebug
MCP-powered reverse engineering platform connecting WinDbg, IDA Pro & x64dbg with 160+ AI-accessible debugging and analysis tools.

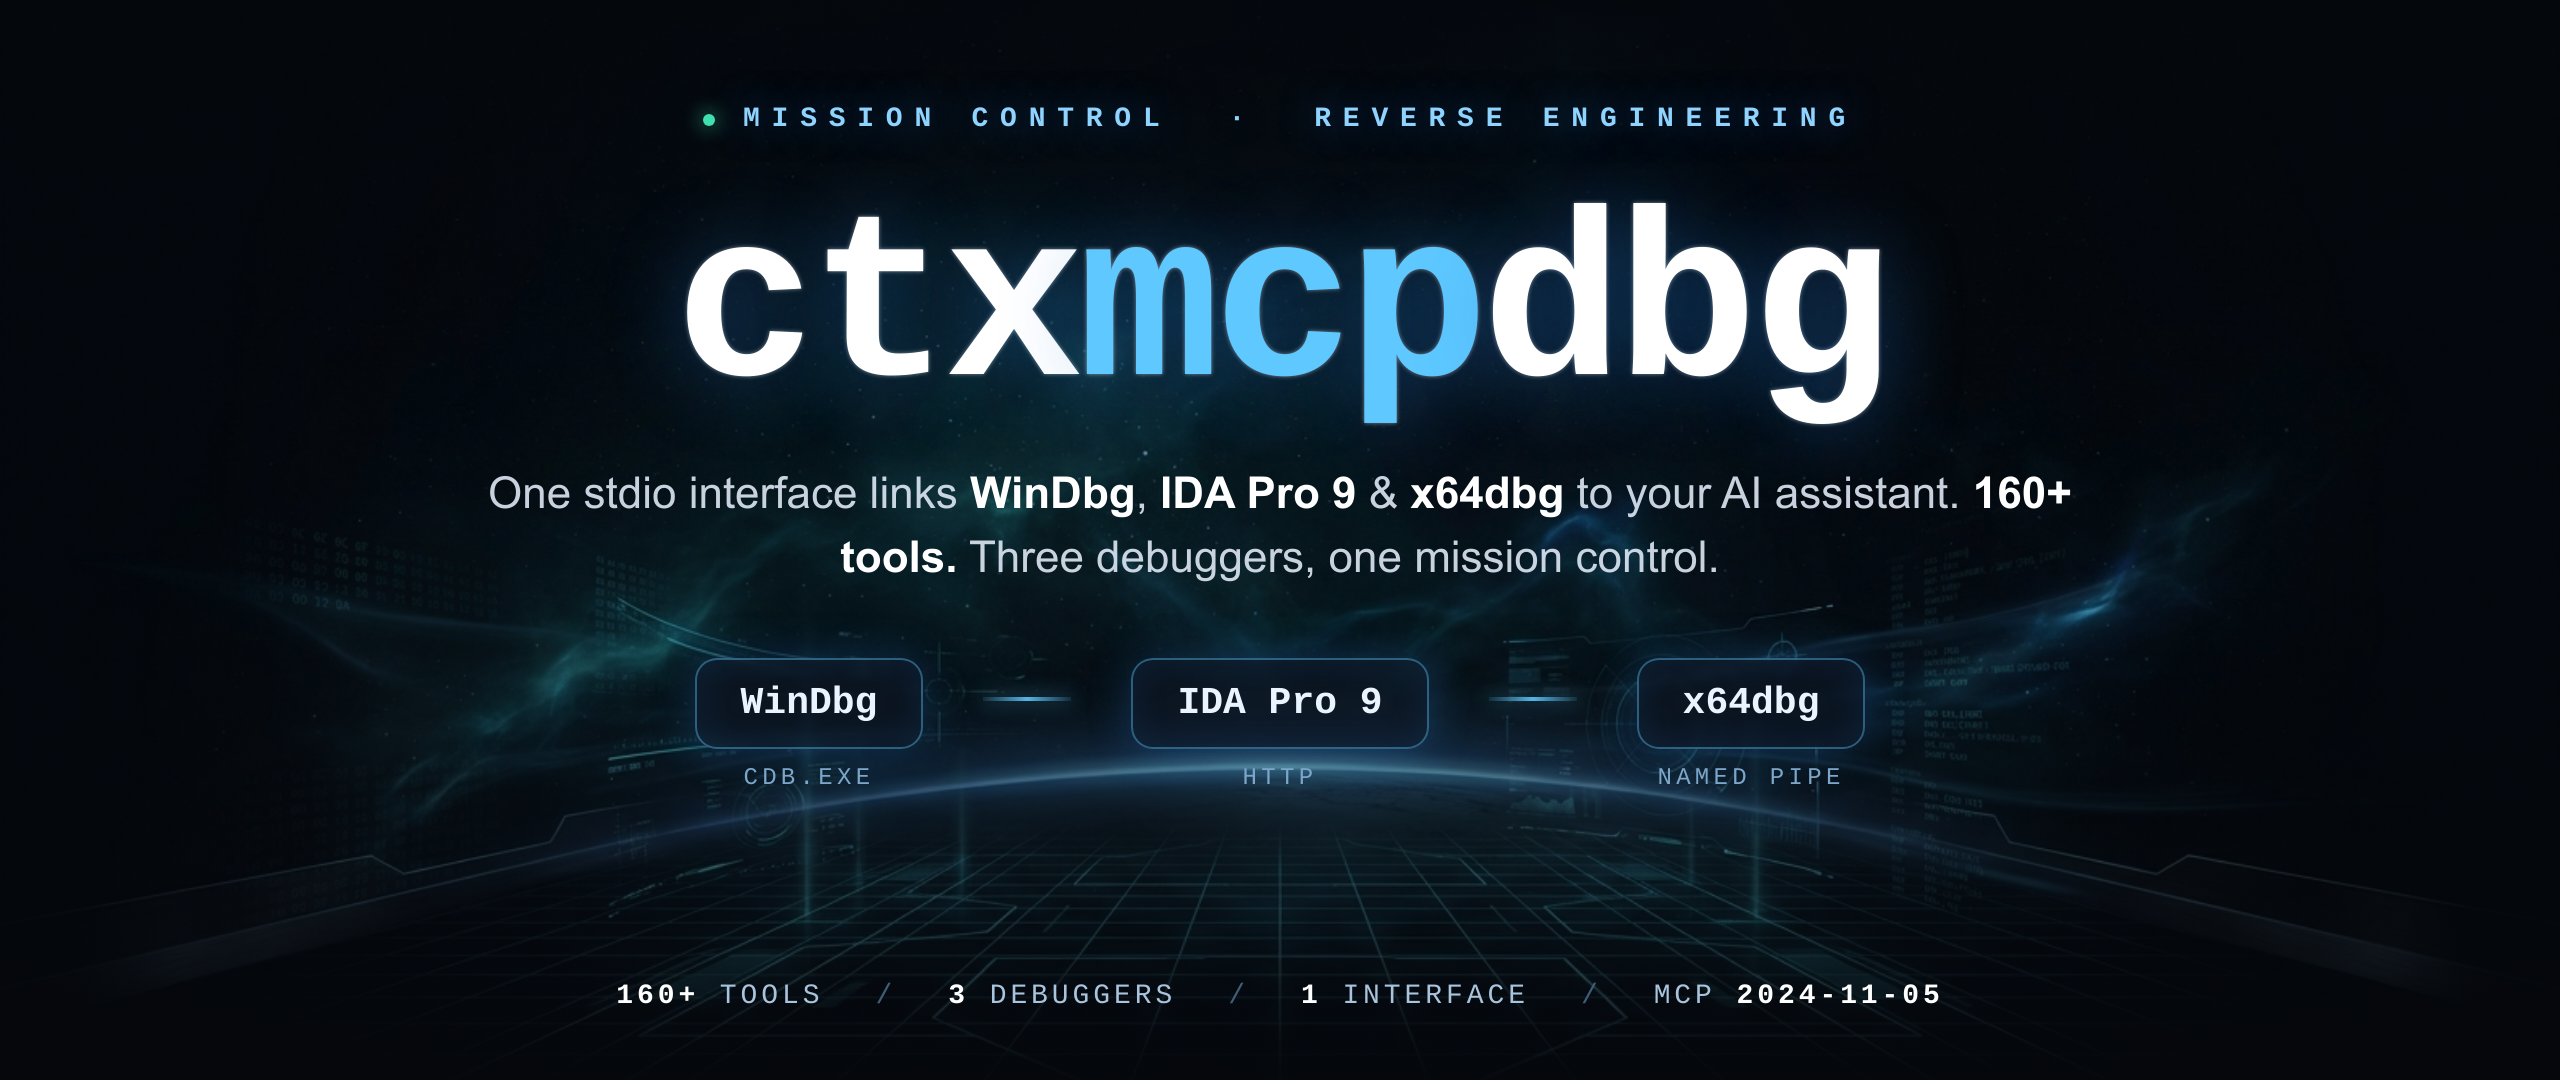
<p align="center"> <img src="https://assets.kitploit.com/production/public/readmes/50042/4855d41b83316e92fb346517ba09fa01e1db754a362433ed57869751d5da2a70.png" alt="ctxdebug — MCP servers for WinDbg, IDA Pro, and x64dbg" width="100%"> </p> <p align="center"> <b>MCP servers for WinDbg, IDA Pro, and x64dbg</b><br> One stdio interface · 160+ tools · Three debuggers, one client. </p> <p align="center"> <img alt="status" src="https://img.shields.io/badge/status-public%20alpha-6B7280?style=flat-square"> <img alt="python" src="https://img.shields.io/badge/python-3.11+-2783DE?style=flat-square&logo=python&logoColor=white"> <img alt="platform" src="https://img.shields.io/badge/platform-Windows%2010/11-4C4C4C?style=flat-square&logo=windows&logoColor=white"> <img alt="mcp" src="https://img.shields.io/badge/MCP-2024--11--05-5E9FE8?style=flat-square"> <img alt="license" src="https://img.shields.io/badge/license-MIT-72BC8F?style=flat-square"> </p> <p align="center"> <a href="#-quick-start">Quick Start</a> · <a href="#-architecture">Architecture</a> · <a href="#-servers">Servers</a> · <a href="#-key-workflows">Workflows</a> · <a href="https://github.com/DdUdle/ctxdebug/issues">Report an Issue</a> </p> <p align="center"> <b>Website</b> · <a href="https://ctxdebug.xyz">ctxdebug.xyz</a> · <b>Contact</b> · <a href="mailto:[email protected]">[email protected]</a> · <b>Status</b> · Public alpha </p> <p align="center"><sub>For authorized reverse engineering, crash analysis, and security research on systems you own or have permission to analyze.</sub></p> --- ## ▎ Overview **ctxdebug** is an MCP (Model Context Protocol) platform that connects **WinDbg**, **IDA Pro 9.x**, and **x64dbg** to AI coding assistants. Use it for crash dump analysis, static review in IDA, and live debugging in x64dbg — without copying output between windows. One stdio interface. **160+ tools.** Three debuggers, one client. > **How it works.** Each debugger is exposed as an MCP tool server. You talk to Claude, Kiro, or any MCP-compatible client; the client calls the debuggers. No copy-paste, no manual correlation between tools. > **Example.** You ask: *"analyze this crash dump and find the root cause."* ctxdebug opens the dump in WinDbg, runs `!analyze -v`, takes the faulting address, decompiles the function in IDA Pro, and returns a combined report with pseudocode and the caller chain. --- ## ▎ Demo <p align="center"> <img src="https://assets.kitploit.com/production/public/readmes/50042/e6a1d5788882512711939900cefc50c51c849a8e8709275f926339ce5a844327.gif" alt="ctxdebug demo — crash dump analysis with WinDbg and IDA in one request" width="100%"> </p> <p align="center"><sub>One prompt → WinDbg opens the dump, analyzes the crash, IDA decompiles the faulting function — combined report in ~1.8s.</sub></p> --- ## ▎ Quick Start ### Requirements - **Python** 3.11+ - **OS** Windows 10 / 11 - **At least one debugger** — WinDbg (Windows SDK) · IDA Pro 9.x · x64dbg ### Install ```bash git clone https://github.com/DdUdle/ctxdebug.git cd ctxdebug pip install -e . ``` ### Register servers Individual servers: ```bash claude mcp add windbg -- python windbg_mcp.py claude mcp add ida -- python ida_mcp.py claude mcp add x64dbg -- python -m agent --mcp claude mcp add mco -- python mco_orchestrator.py claude mcp add mco-sessions -- python mco_sessions.py ``` Or use the unified gateway — one server, every tool: ```bash claude mcp add mco-gateway -- python mco_gateway.py ``` See `mcp_config_example.json` for full JSON configuration with environment variables. ### Try it Once a server is registered, ask your AI client: ```text Open C:\dumps\crash.dmp, run a full crash analysis, and decompile the function at the fault address. ``` The orchestrator chains `windbg_open_dump` → `windbg_analyze_crash` → `mco_pivot_to_ida` and returns pseudocode with the caller chain. --- ## ▎ Features | Capability | What it does | |---|---| | **Live debugger control** | Run, pause, step, and inspect a process through x64dbg. Set breakpoints on API groups (`memory`, `network`, `crypto`) instead of one address at a time. | | **Cross-debugger pivot** | Take an address from a WinDbg crash dump and open it in IDA Pro for decompilation, callers, and callees in one tool call. | | **Goal-driven analysis** | The x64dbg server includes an optional ReAct agent (`agent_analyze`) that plans multi-step goals — for example finding an unpacking loop or listing anti-analysis checks — by chaining tool calls. Works with Claude, Groq, local Ollama, or heuristics only. | | **Persistent notes** | The agent stores packer signatures, anti-analysis patterns, and notes from earlier sessions, and can recall them on new targets. | | **Session recording** | Tool calls can be logged to SQLite with full-text search (FTS5). Replay a timeline, compare two sessions, or export a Markdown report. | | **Anti-analysis survey** | Combines a static scan (IDA imports/patterns) and a dynamic scan (x64dbg PEB/RDTSC) into one report. Optional lab patches (PEB flags, instruction edits) for samples you are authorized to analyze. | --- ## ▎ Architecture <p align="center"> <img src="https://assets.kitploit.com/production/public/readmes/50042/4b8779ec7f8e4ef06631b5c1d4c472557ffe399b46111bcd360982c5950ba67b.png" alt="System architecture — one MCP connection to three debuggers, an orchestrator, and a session layer" width="100%"> </p> - **Transport** — stdio JSON-RPC (MCP `2024-11-05`) - **IDA** — HTTP REST on `localhost:2022`, auto-discovers the endpoint from 6 candidates - **x64dbg** — binary framing over a named pipe (`X64A` magic + uint32 length + 8-byte padding + JSON) - **Agent** — ReAct loop with pluggable LLM backends (Claude, Groq, OpenRouter, local Ollama, or heuristics only) - **Sessions** — SQLite with FTS5, WAL mode, thread-safe - **Gateway** — starts sub-servers as child processes and proxies tool calls through one stdio connection --- ## ▎ Servers | Server | File | What it does | Tools | |---|---|---|:--:| | `windbg` | `windbg_mcp.py` | Crash dumps, heap analysis, shadow stack, kernel debugging | 70+ | | `ida` | `ida_mcp.py` | Decompilation, xrefs, type recovery, binary patching | 32+ | | `x64dbg` | `agent/` | Dynamic analysis, ReAct agent, memory inspection and patching | 38+ | | `mco` | `mco_orchestrator.py` | Cross-debugger compound workflows | 7 | | `mco-sessions` | `mco_sessions.py` | Session recording, FTS search, Markdown export | 13 | | `mco-gateway` | `mco_gateway.py` | Unified proxy — all servers through one connection | all | --- ## ▎ Debugger setup <details> <summary><b>WinDbg</b></summary> Needs `cdb.exe` from the Windows SDK. Default path: ```text C:\Program Files (x86)\Windows Kits\10\Debuggers\x64\cdb.exe ``` Set `WINDBG_MCP_CDB` if your path differs. No pre-launch needed — tools open dumps or attach on demand. </details> <details> <summary><b>IDA Pro 9.x</b></summary> 1. Open IDA Pro 9.x with a binary loaded. 2. In the Python console, run: ```python exec(open(r'path\to\ctxdebug\ida_server_plugin.py').read()) ``` 3. HTTP server starts on port `2022`. </details> <details> <summary><b>x64dbg</b></summary> 1. Build the C++ plugin: ```bash cd agent\plugins build_plugin.bat ``` 2. Copy `mco_agent.dp64` to x64dbg's plugin directory. 3. Restart x64dbg — the plugin exposes named pipe `\\.\pipe\x64dbg_ai_agent`. </details> --- ## ▎ Key Workflows **Crash dump → source (one command)** ```python mco_crash_to_source(dump_path="C:\\dumps\\crash.dmp") ``` Opens the dump, runs `!analyze -v`, extracts the faulting address, decompiles the crashing function in IDA, and returns pseudocode with callers. **Anti-analysis report** ```python mco_bossix_report() bossix_hide() # PEB flag adjustments (lab) bossix_patch(address) # NOP / flip JCC at a check (lab) ``` For authorized lab analysis of samples that implement anti-debug checks. **Pivot an address to pseudocode** ```python mco_pivot_to_ida(address="0x7FF712340000") ``` **Goal-driven analysis** ```python agent_analyze(goal="Find the unpacking loop and identify the OEP") ``` The agent plans a sequence of tool calls, executes them, and reports findings — with or without an LLM backend. **Session recording** ```python session_start(name="crash dump review") # ... do your work ... session_end(notes="null deref in CRenderObject::Destroy") session_export_markdown(session_id=1) ``` --- ## ▎ x64dbg Server Modes | Mode | Command | |---|---| | Tool-only (default) | `python -m agent --mcp` | | Claude reasoning | `python -m agent --mcp --llm claude --api-key sk-...` | | Local Ollama | `python -m agent --mcp --llm local --llm-model deepseek-r1` | | Groq (free tier) | `python -m agent --mcp --llm groq` | | OpenRouter | `python -m agent --mcp --llm openrouter` | | Interactive CLI | `python -m agent --cli` | --- ## ▎ Environment Variables | Variable | Server | Purpose | |---|---|---| | `WINDBG_MCP_CDB` | windbg | Path to cdb.exe | | `IDA_MCP_HOST` | ida | IDA HTTP host (default: `localhost`) | | `IDA_MCP_PORT` | ida | IDA HTTP port (default: `2022`) | | `IDA_MCP_TOKEN` | ida | Bearer token for the IDA HTTP server — required to bind it off loopback | | `IDA_SERVER_HOST` | ida | Bind address of the in-IDA HTTP server (default: `127.0.0.1`) | | `X64DBG_PATH` | x64dbg | Path to x64dbg.exe | | `X64DBG_PIPE` | x64dbg | Named pipe path | | `ANTHROPIC_API_KEY` | x64dbg | Only needed with `--llm claude` | | `GROQ_API_KEY` | x64dbg | Only needed with `--llm groq` | | `MCO_SESSIONS_DB` | sessions | SQLite database path | | `MCO_SERVERS` | gateway | Comma-separated subset of servers to enable | --- ## ▎ Project Structure ```text ctxdebug/ ├── windbg_mcp.py # WinDbg MCP server ├── ida_mcp.py # IDA Pro MCP server ├── ida_server_plugin.py # IDA Python plugin (starts HTTP server) ├── mco_orchestrator.py # Cross-debugger meta-tools ├── mco_sessions.py # Session recording (SQLite + FTS5) ├── mco_gateway.py # Unified gateway proxy ├── agent/ │ ├── __main__.py # x64dbg MCP entry point + LLM backend selection │ ├── core.py # ReAct agent (Observe → Think → Act) │ ├── memory.py # Persistent memory store (~/.x64ai/) │ ├── bridge.py # Named-pipe IPC to x64dbg plugin │ ├── mcp_server.py # Tool definitions (38+) │ ├── skills/ # Modular skill implementations │ └── plugins/ │ ├── x64dbg_plugin.cpp │ └── build_plugin.bat ├── mcp_config_example.json # Ready-to-use MCP client config └── pyproject.toml ``` --- ## ▎ Development ```bash git clone https://github.com/DdUdle/ctxdebug.git cd ctxdebug pip install -e ".[dev]" pytest ``` --- ## ▎ Contributing Contributions are welcome. Please open an issue before starting large changes so the approach can be discussed first. --- ## ▎ License **MIT** — see [`LICENSE`](https://github.com/ddudle/ctxdebug/blob/main/LICENSE). <p align="center"><sub>WinDbg · IDA Pro · x64dbg — one MCP client.</sub></p>
