PenguinTrace - Tool To Show How Code Runs At The Hardware Level
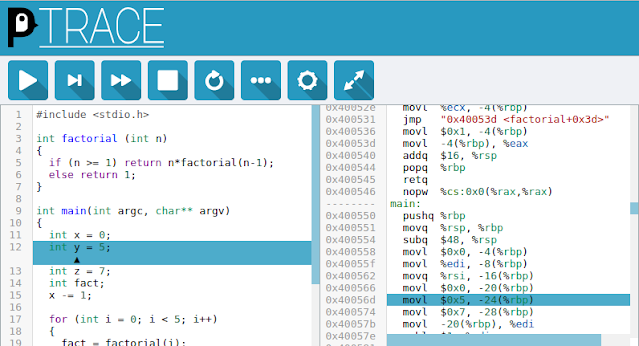
penguinTrace is intended to help build an understanding of how programs run at the hardware level. It provides a way to see what instructions compile to, and then step through those instructions and see how they affect machine state as well as how this maps back to variables in the original program. A bit more background is available on the website.
penguinTrace starts a web-server which provides a web interface to edit and run code. Code can be developed in C, C++ or Assembly. The resulting assembly is then displayed and can then be stepped through, with the values of hardware registers and variables in the current scope shown.
penguinTrace runs on Linux and supports the AMD64/X86-64 and AArch64 architectures. penguinTrace can run on other operating systems using Docker, a virtual machine or through the Windows Subsystem for Linux (WSL).

The primary goal of penguinTrace is to allow exploring how programs execute on a processor, however the development provided an opportunity to explore how debuggers work and some lower-level details of interaction with the kernel.
Note: penguinTrace allows running arbitrary code as part of its design. By default it will only listen for connections from the local machine. It should only be configured to listen for remote connections on a trusted network and not exposed to the interface. This can be mitigated by running penguinTrace in a container, and a limited degree of isolation of stepped code can be provided when
libcapis available.
Getting Started
Prerequisites
penguinTrace requires 64-bit Linux running on a X86-64 or AArch64 processor. It can also run on a Raspberry Pi running a 64-bit (AArch64) Linux distribution. For other operating systems, it can be run on Windows 10 using the Windows Subsystem for Linux (WSL) or in a Docker container. WSL does not support tracee process isolation.
python
clang
llvm
llvm-dev
libclang-dev
libcap-dev # For containment
Building
To build penguinTrace outside of a container, clone the repository and run make. The binaries will be placed in build/bin by default.
To build penguinTrace in Docker, run docker build -t penguintrace github.com/penguintrace/penguintrace.
Running
Once penguinTrace is built, running the penguintrace binary will start the server.
If built in a container it can then be run with docker run -it -p 127.0.0.1:8080:8080 --tmpfs /tmp:exec --cap-add=SYS_PTRACE --cap-add=SYS_ADMIN --rm --security-opt apparmor=unconfined penguintrace penguintrace. See Containers for details on better isolating the container.
Then navigate to 127.0.0.1:8080 or localhost:8080 to access the web interface.
Note: In order to run on port 80, you can modify the
docker runcommand to map from port 8080 to port 80, e.g.-p 127.0.0.1:80:8080.If built locally, you can modify the binary to allow it to bind to port 80 with
sudo setcap CAP_NET_BIND_SERVICE=+ep penguintrace. It can then be run withpenguintrace -c SERVER_PORT 80penguinTrace defaults to port 8080 as it is intended to be run as an unprivileged user.
Temporary Files
The penguinTrace server uses the system temporary directory as a location for compiled binaries and environments for running traced processes. If the PENGUINTRACE_TMPDIR environment variable is defined, this directory will be used. It will fall back to the TMPDIR environment variable and finally the directories specified in the C library.
This must correspond to a directory without noexec set, if running in a container it is likely the filesystem will have this set by default.
Networking
By default penguinTrace only listens on the loopback device and IPv4. If the server is configured to listen on all addresses, then also setting the server to IPv6 will allow connections on both IPv4 and IPv6, this is the default mode when running in a Docker container.
This is because penguinTrace only creates a single thread to listen to connections and so can currently only bind to a single address or all addresses.
Session Handling
By default penguinTrace runs in multiple session mode, each time code is compiled a new session is created. The URL fragment (after the '#') of the UI is updated with the session id, and this URL can be used to reconnect to the same session.
If running in single session mode each penguinTrace instance only supports a single debugging instance. The web UI will automatically reconnect to a previous session. To support multiple sessions, multiple instances should be launched which are listening on different ports.
Containers
The docker_build.sh and docker_run.sh scripts provide an example of how to run penguinTrace in a Docker container. Dockerfile_noisolate provides an alterative way of running that does not require the SYS_ADMIN capability but provides less isolation between the server and the traced processes. The SYS_PTRACE capability is always required for the server to trace processes. misc/apparmor-profile provides an example AppArmor profile that is suitable for running penguinTrace but may need some customisation for the location of temporary directories and compilers.
AArch64 / Raspberry Pi
penguinTrace will only run under a 64-bit operating system. The official operating systems provided for the Raspberry Pi are all 32-bit, to run penguinTrace something such as pi64 or Arch Linux Arm is required.
Full instructions for setting up a 64-bit OS on Raspberry Pi TBD.
Authors
penguinTrace is developed by Alex Beharrell.
License
This project is licensed under the GNU AGPL. A non-permissive open source license is chosen as the intention of this project is educational, and so any derivative works should have the source available so that people can learn from it.
The bundling of the source code relies on the structure of the repository. Derivative works that are not forked from a penguinTrace repository will need to modify the Makefile rules for static/source.tar.gz to ensure the modified source is correctly distributed.
Acknowledgements
penguinTrace makes use of jQuery and CodeMirror for some aspects of the web interface. Both are licensed under the MIT License. It also uses the Major Mono font which is licensed under the Open Font License.
 Reviewed by Zion3R
on
8:30 AM
Rating:


